
The Biotech Compass Hub
I have developed The Biotech Compass to help investors keep up with the biotech sector. All the resources you need to run this free tool yourself are available here.


With hundreds of biotech companies in the market, staying informed can be overwhelming for investors.
That is why I have developed The Biotech Compass: a free-to-use AI pipeline which takes company tickers and turns them into visual charts and readable briefing notes to kick start your research.
Here in The Biotech Compass Hub, you will find everything you need to know about the Biotech Compass, and links to all the resources required to run the tool yourself.
To run the Biotech Compass, the prompts and code are available here:
And a step-by-step walkthrough can be found here:
Start Here
This hub includes:
a brief overview of what the Biotech Compass is and what it generates
an example Compass chart and explanation of what it shows
a guide to interpreting the chart
a breakdown of the full AI pipeline and its output files
links to all prompts, code, walkthroughs, and example outputs
If you’d like to explore further, here are the key companion articles:
If you’re new to the Biotech Compass:
→ The Biotech Compass: A Practical Tool for Biotech Investors
If you want to run the tool yourself:
→ The Biotech Compass v1.0: Prompts and Code
If you want a step-by-step walkthrough:
→ The Biotech Compass: Practical Run Guide
If you want to see a full example output:
→ The Biotech Compass: Readable Briefings
If you want to explore the raw output files:
→ The Biotech Compass: Raw Output
What is the Biotech Compass?
The Biotech Compass is an AI-powered biotech analysis tool that turns a handful of tickers into a clear, readable research pack in under an hour.
Through a series of meticulously designed LLM prompts, The Biotech Compass generates:
a visually intuitive chart mapping biotech companies by key pipeline attributes
a fully sourced briefing document built from primary company materials and SEC filings
a side-by-side snapshot of up to five biotech companies at once
The goal is simple:
Go from “I’ve never heard of this biotech” to “I understand the pipeline, the risk profile, and its position in the wider biotech landscape” - and fast.
For the detailed overview, see my article The Biotech Compass: A Practical Tool for Biotech Investors, linked below.
The Biotech Compass Chart
Here is an example Biotech Compass chart showing Protagonist Therapeutics ($PTGX), BridgeBio ($BBIO), and Neurogene ($NGNE). The Compass can be used to analyse up to five companies at a time.
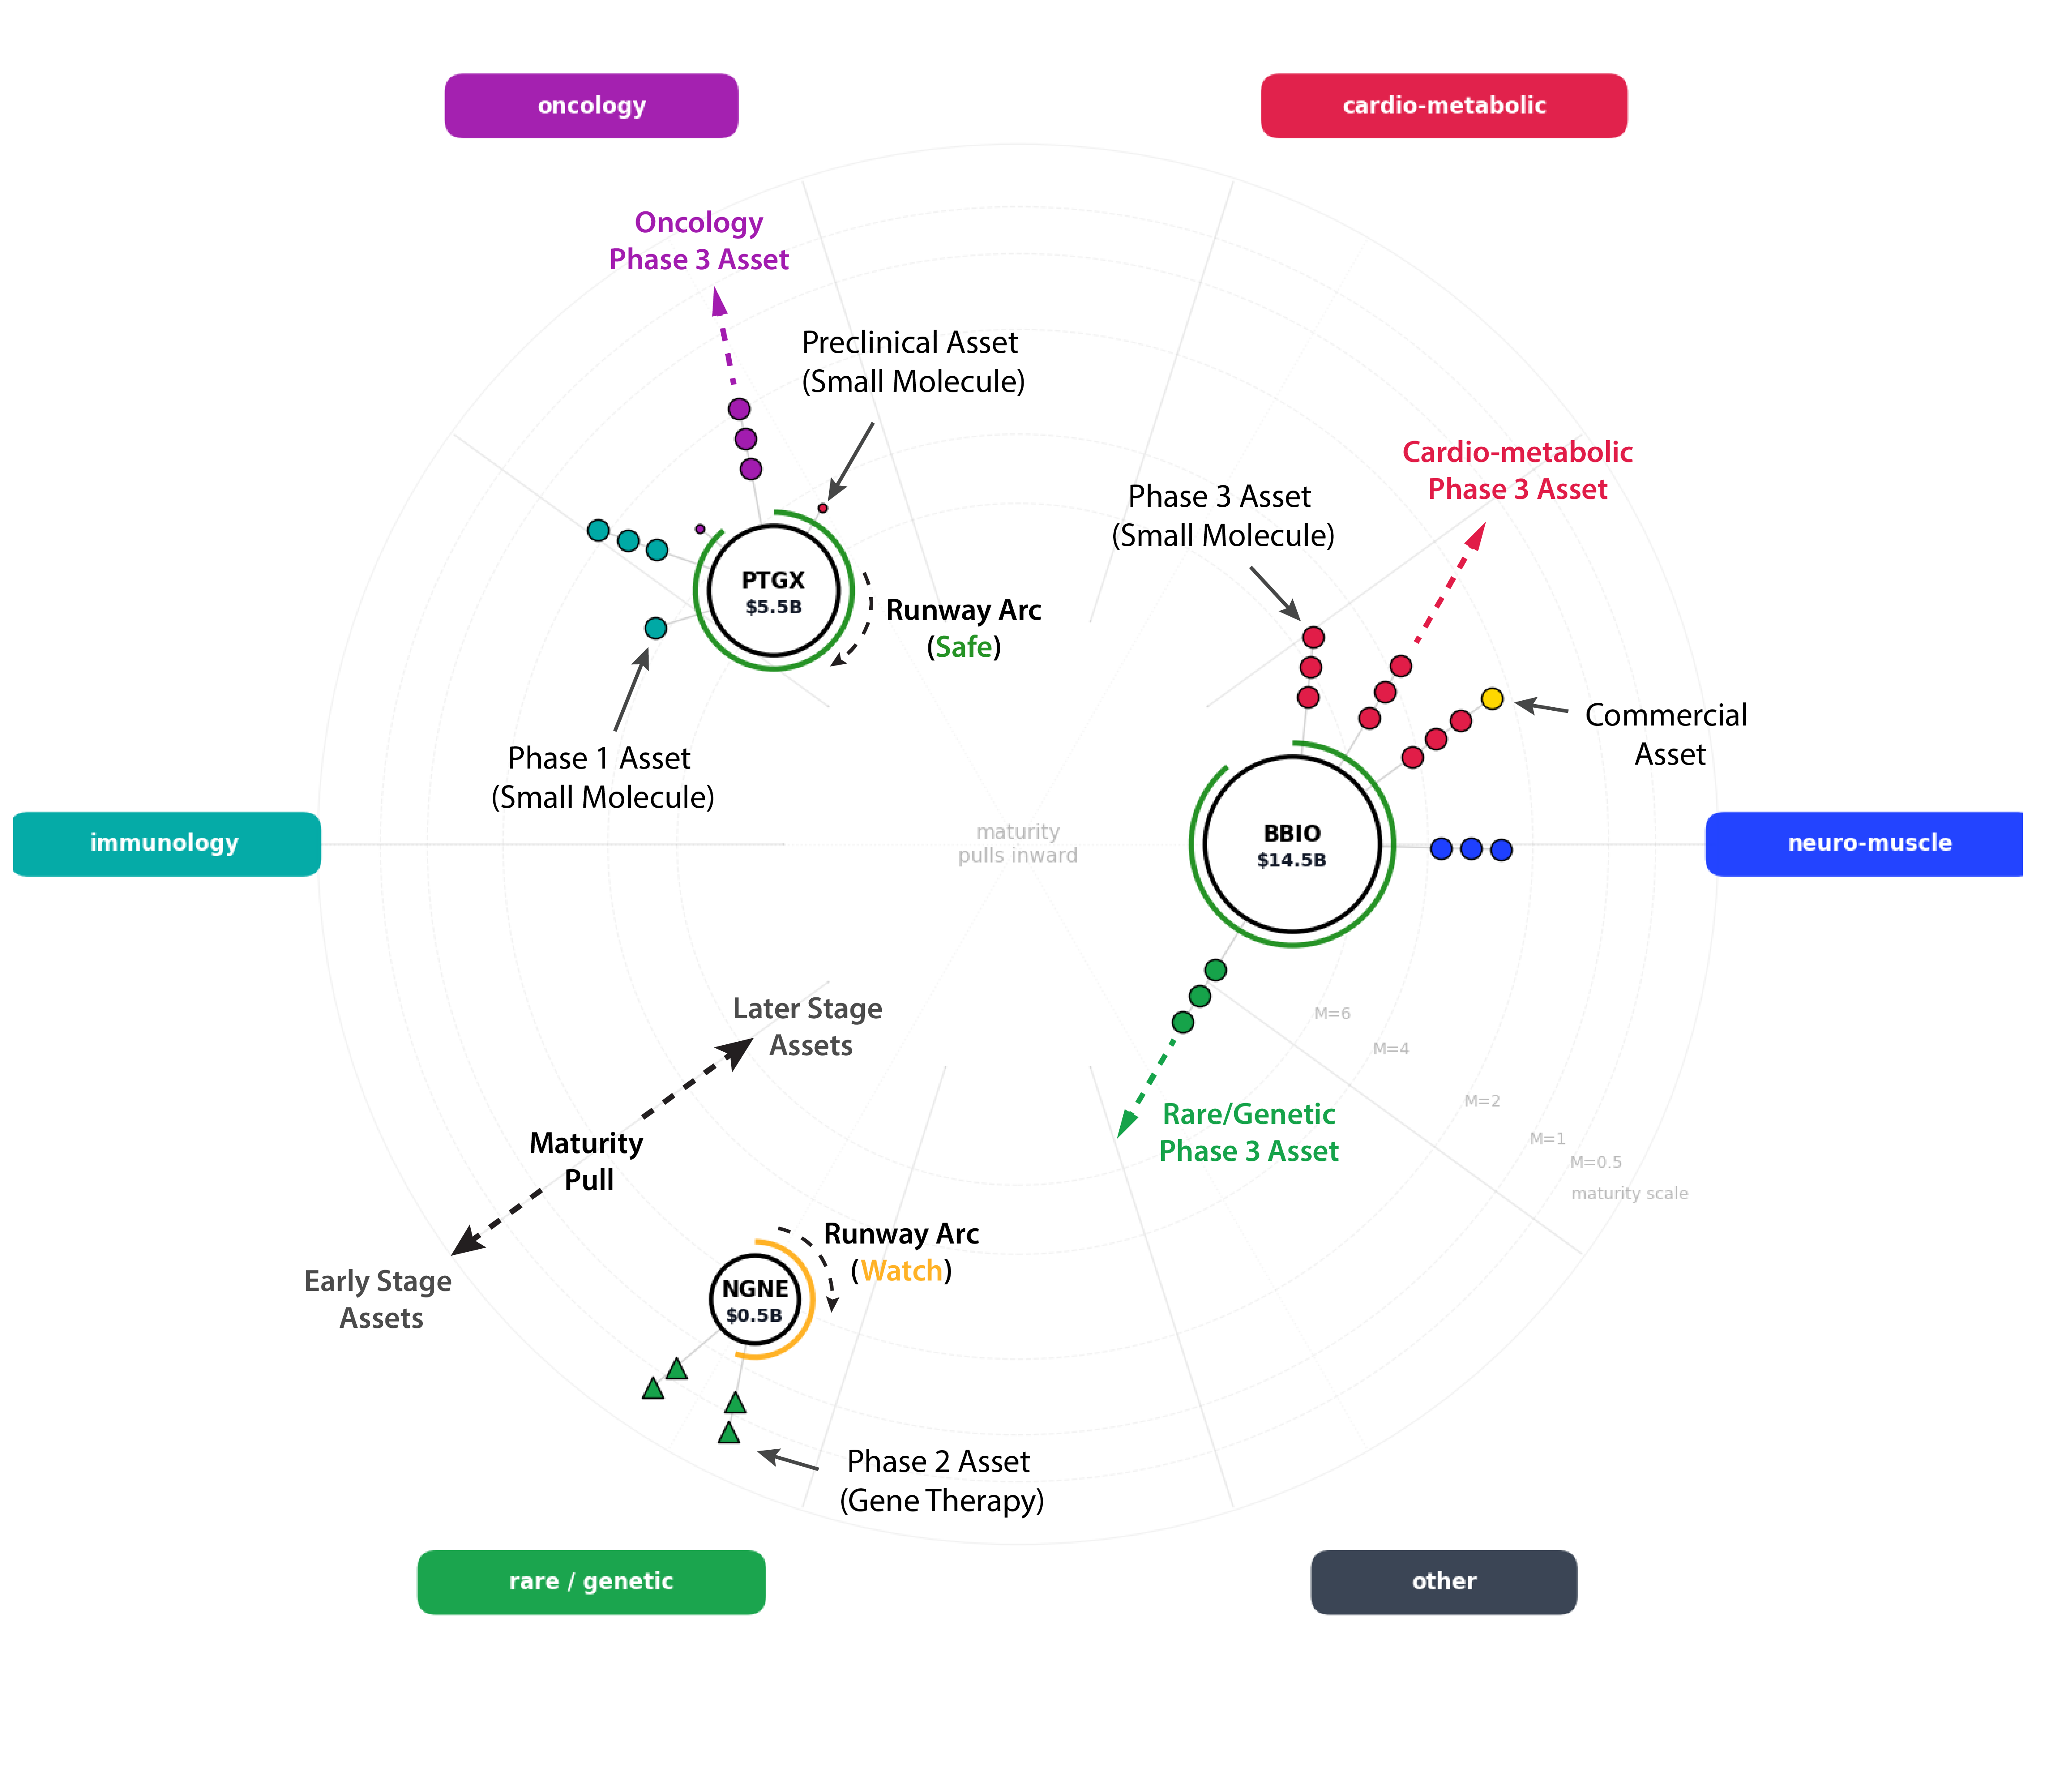
The chart displays the following company attributes:
Pipeline breadth - number of disclosed assets
Pipeline maturity - highest clinical stage reached
Disease focus - therapeutic areas being targeted
Drug modality - small molecule, biologic, gene therapy, etc.
Commercial status - presence of revenue-generating or approved products
Market cap - current valuation
Cash runway - financial stability and funding horizon
Together, these attributes provide a visual overview of pipeline breadth, maturity, and financial risk profile at a glance. You can also directly compare multiple companies simultaneously.
Why use the Biotech Compass?
Traditional research means piecing together fragmented information company-by-company, making it nearly impossible to spot patterns or make fair comparisons.
The Biotech Compass uses an unbiased data collection strategy to present multiple companies simultaneously in a visually intuitive format.
Striking differences in pipeline breadth, market cap, and risk profile become immediately obvious: insights that I find difficult to discern in spreadsheet rows.
You can see which companies are genuinely similar versus fundamentally different, identify sector patterns, and make comparative assessments in seconds rather than hours of manual analysis.
Furthermore, the strict data extraction and sourcing throughout means you can rely on and follow up the data presented.
To see a full example of a complete Biotech Compass output, see the Readable Briefings article linked below:
How to run The Biotech Compass Yourself
Prompts and Code
You can run the Biotech Compass yourself using the same prompts and code I use - free for all subscribers:
Walkthrough
I’ve also written a detailed walkthrough that takes you step-by-step through the full process. You can follow it here:
The walkthrough run features the following companies:
Beam Therapeutics ($BEAM), Kiniksa Pharmaceuticals ($KNSA), PTC Therapeutics ($PTCT), Viking Therapeutics ($VKTX), and Gossamer Bio ($GOSS).
Each is accompanied by analysis using the Biotech Compass chart.
How to Interpret the Biotech Compass
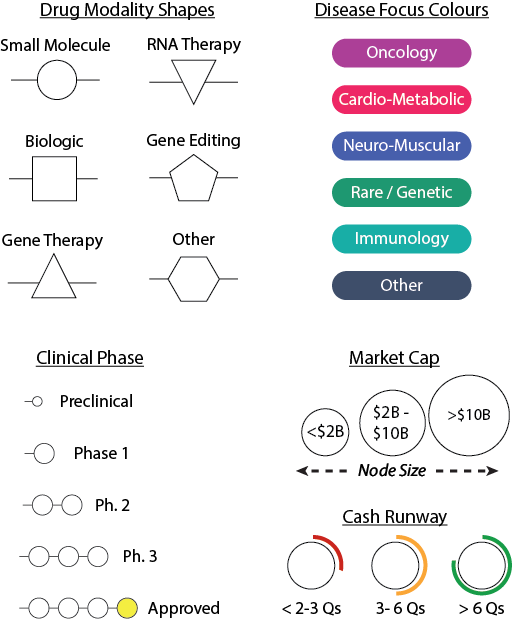
Node Decoration
Companies are plotted as nodes on the chart, decorated to display pipeline breadth, drug modality, disease focus, and cash runway. Node size reflects market cap.
Angular and Radial Position
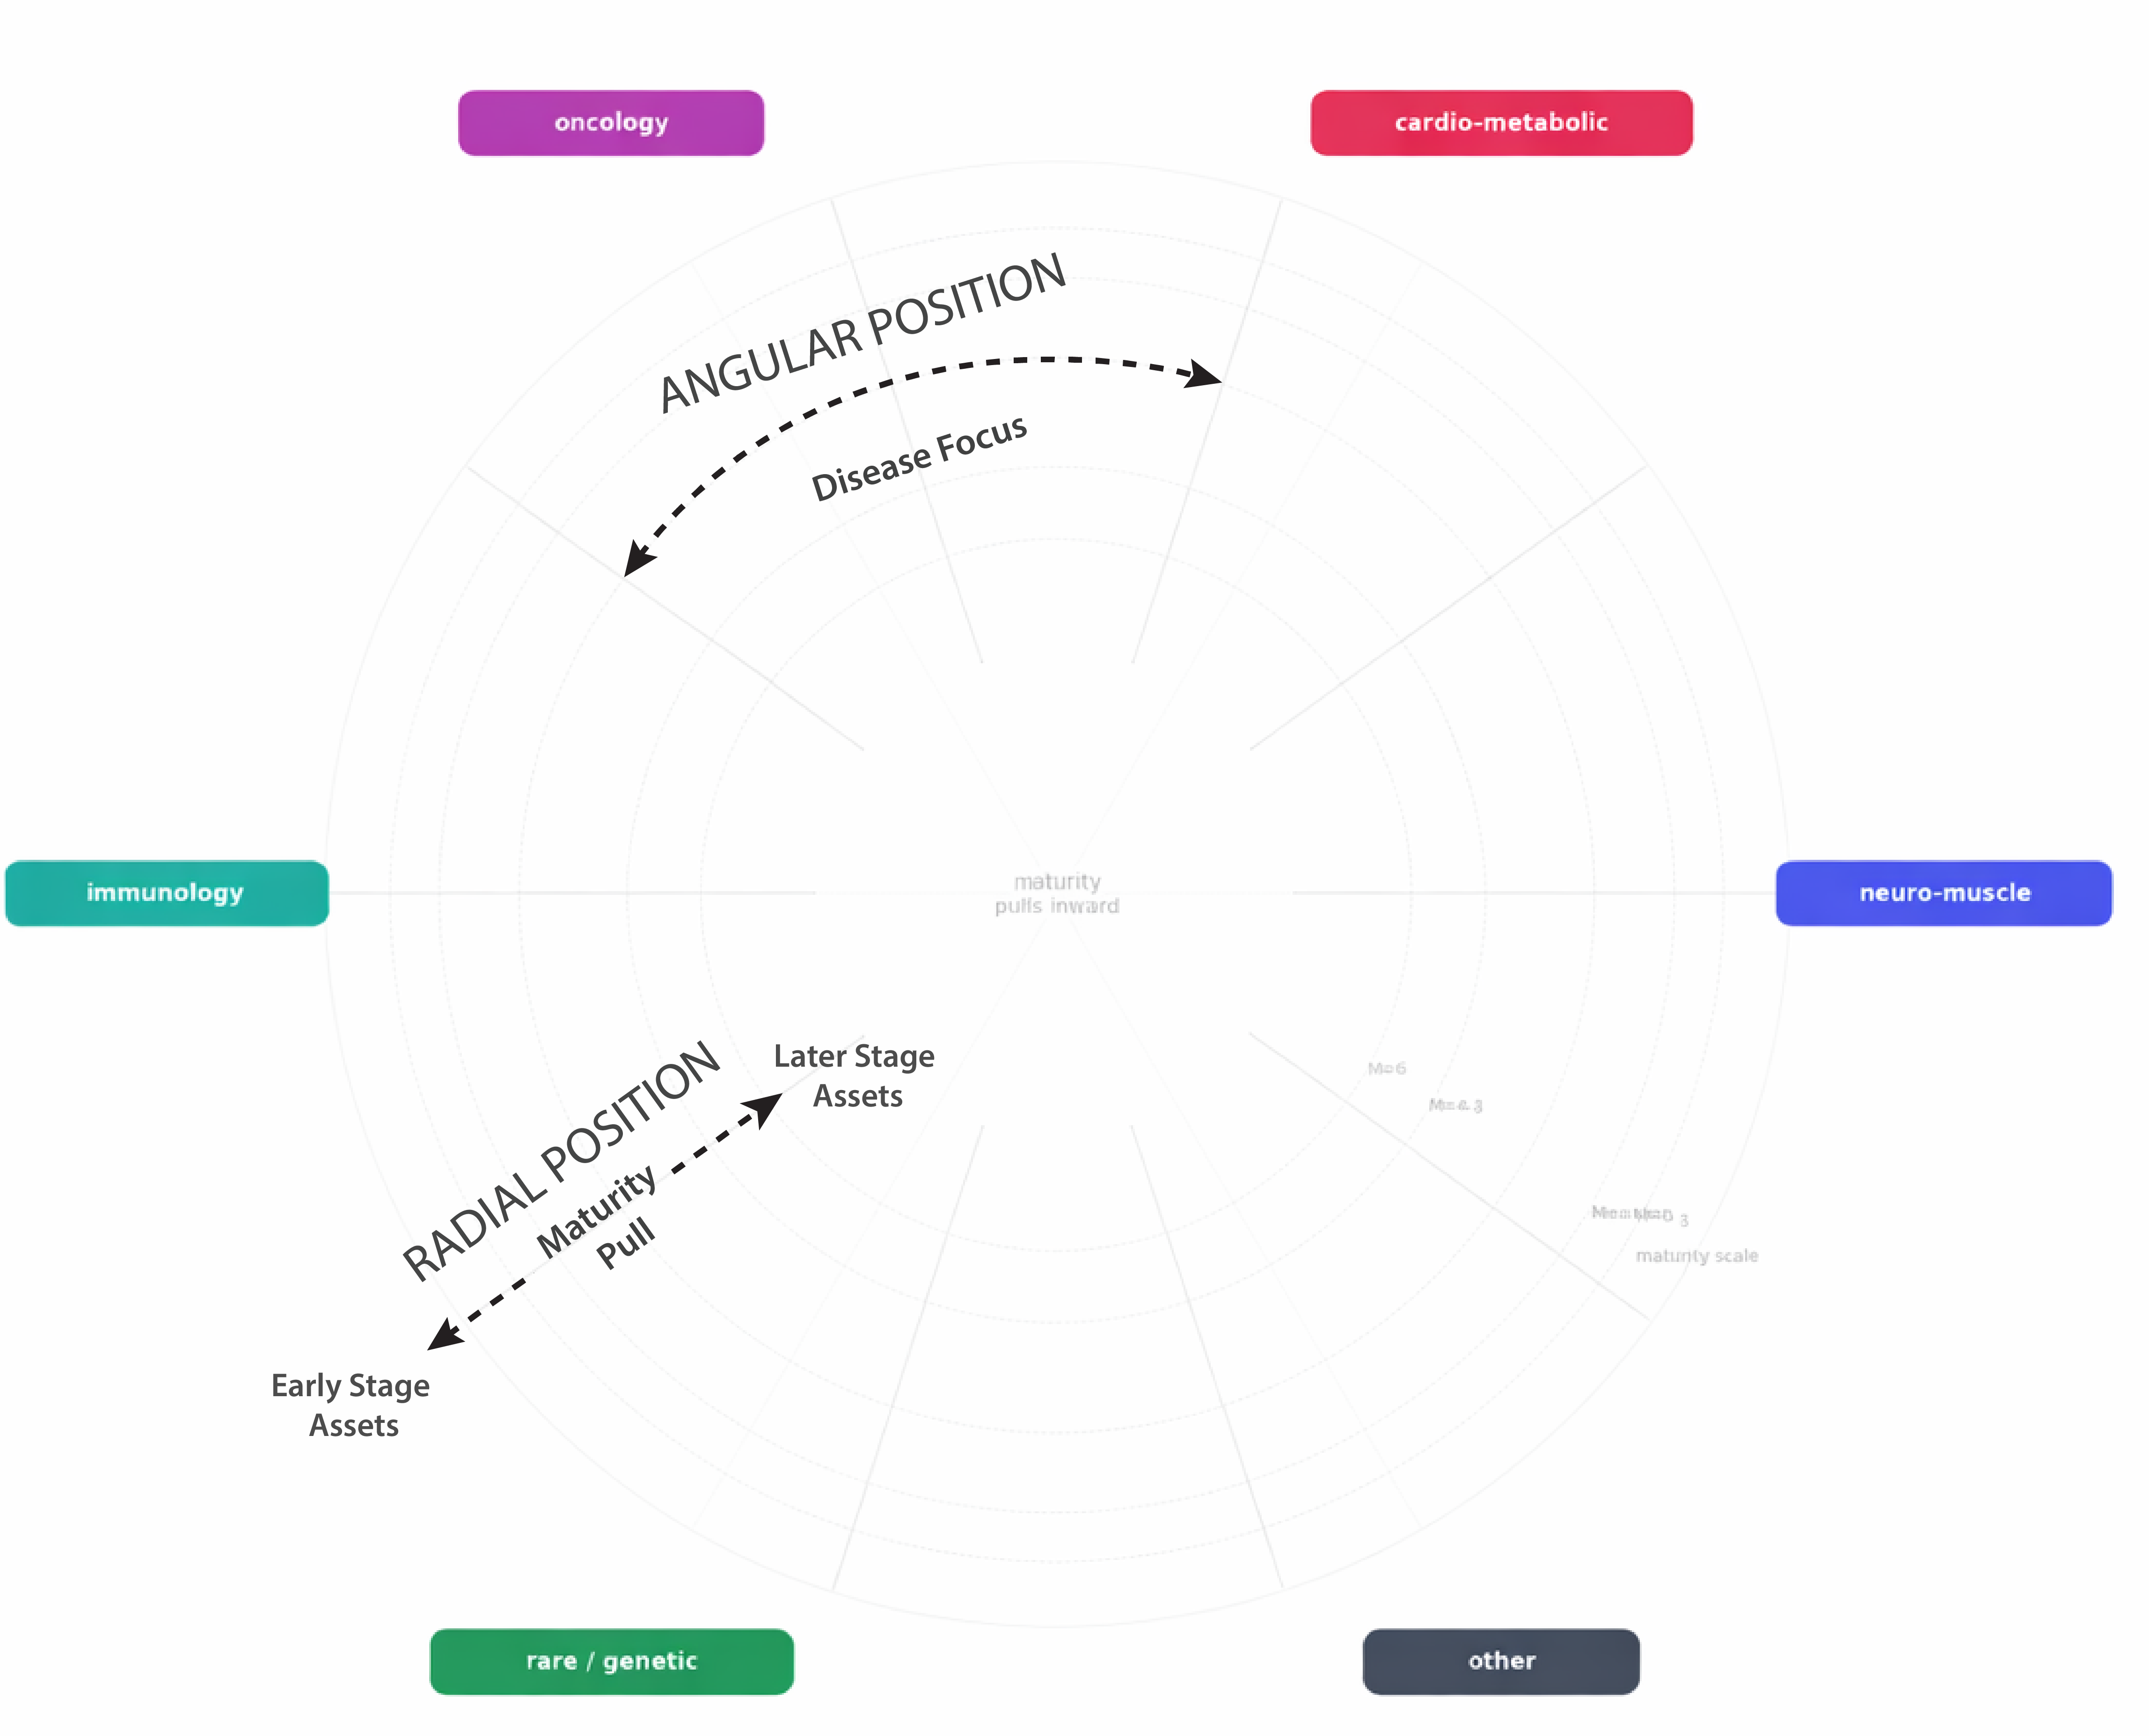
Companies are positioned on the chart using a combination of angular position (around the chart) and radial position (from edge to centre). Disease focus determines the angular position, while the weighted maturity of the company’s overall pipeline determines how close it sits to the edge (few early-stage assets) or towards the centre (many late-stage assets).
For a more detailed overview, see The Biotech Compass: A Practical Tool for Biotech Investors article.
Additional Resources
The Biotech Compass uses an AI pipeline to acquire data to populate the Biotech Compass Chart. The pipeline is described below:
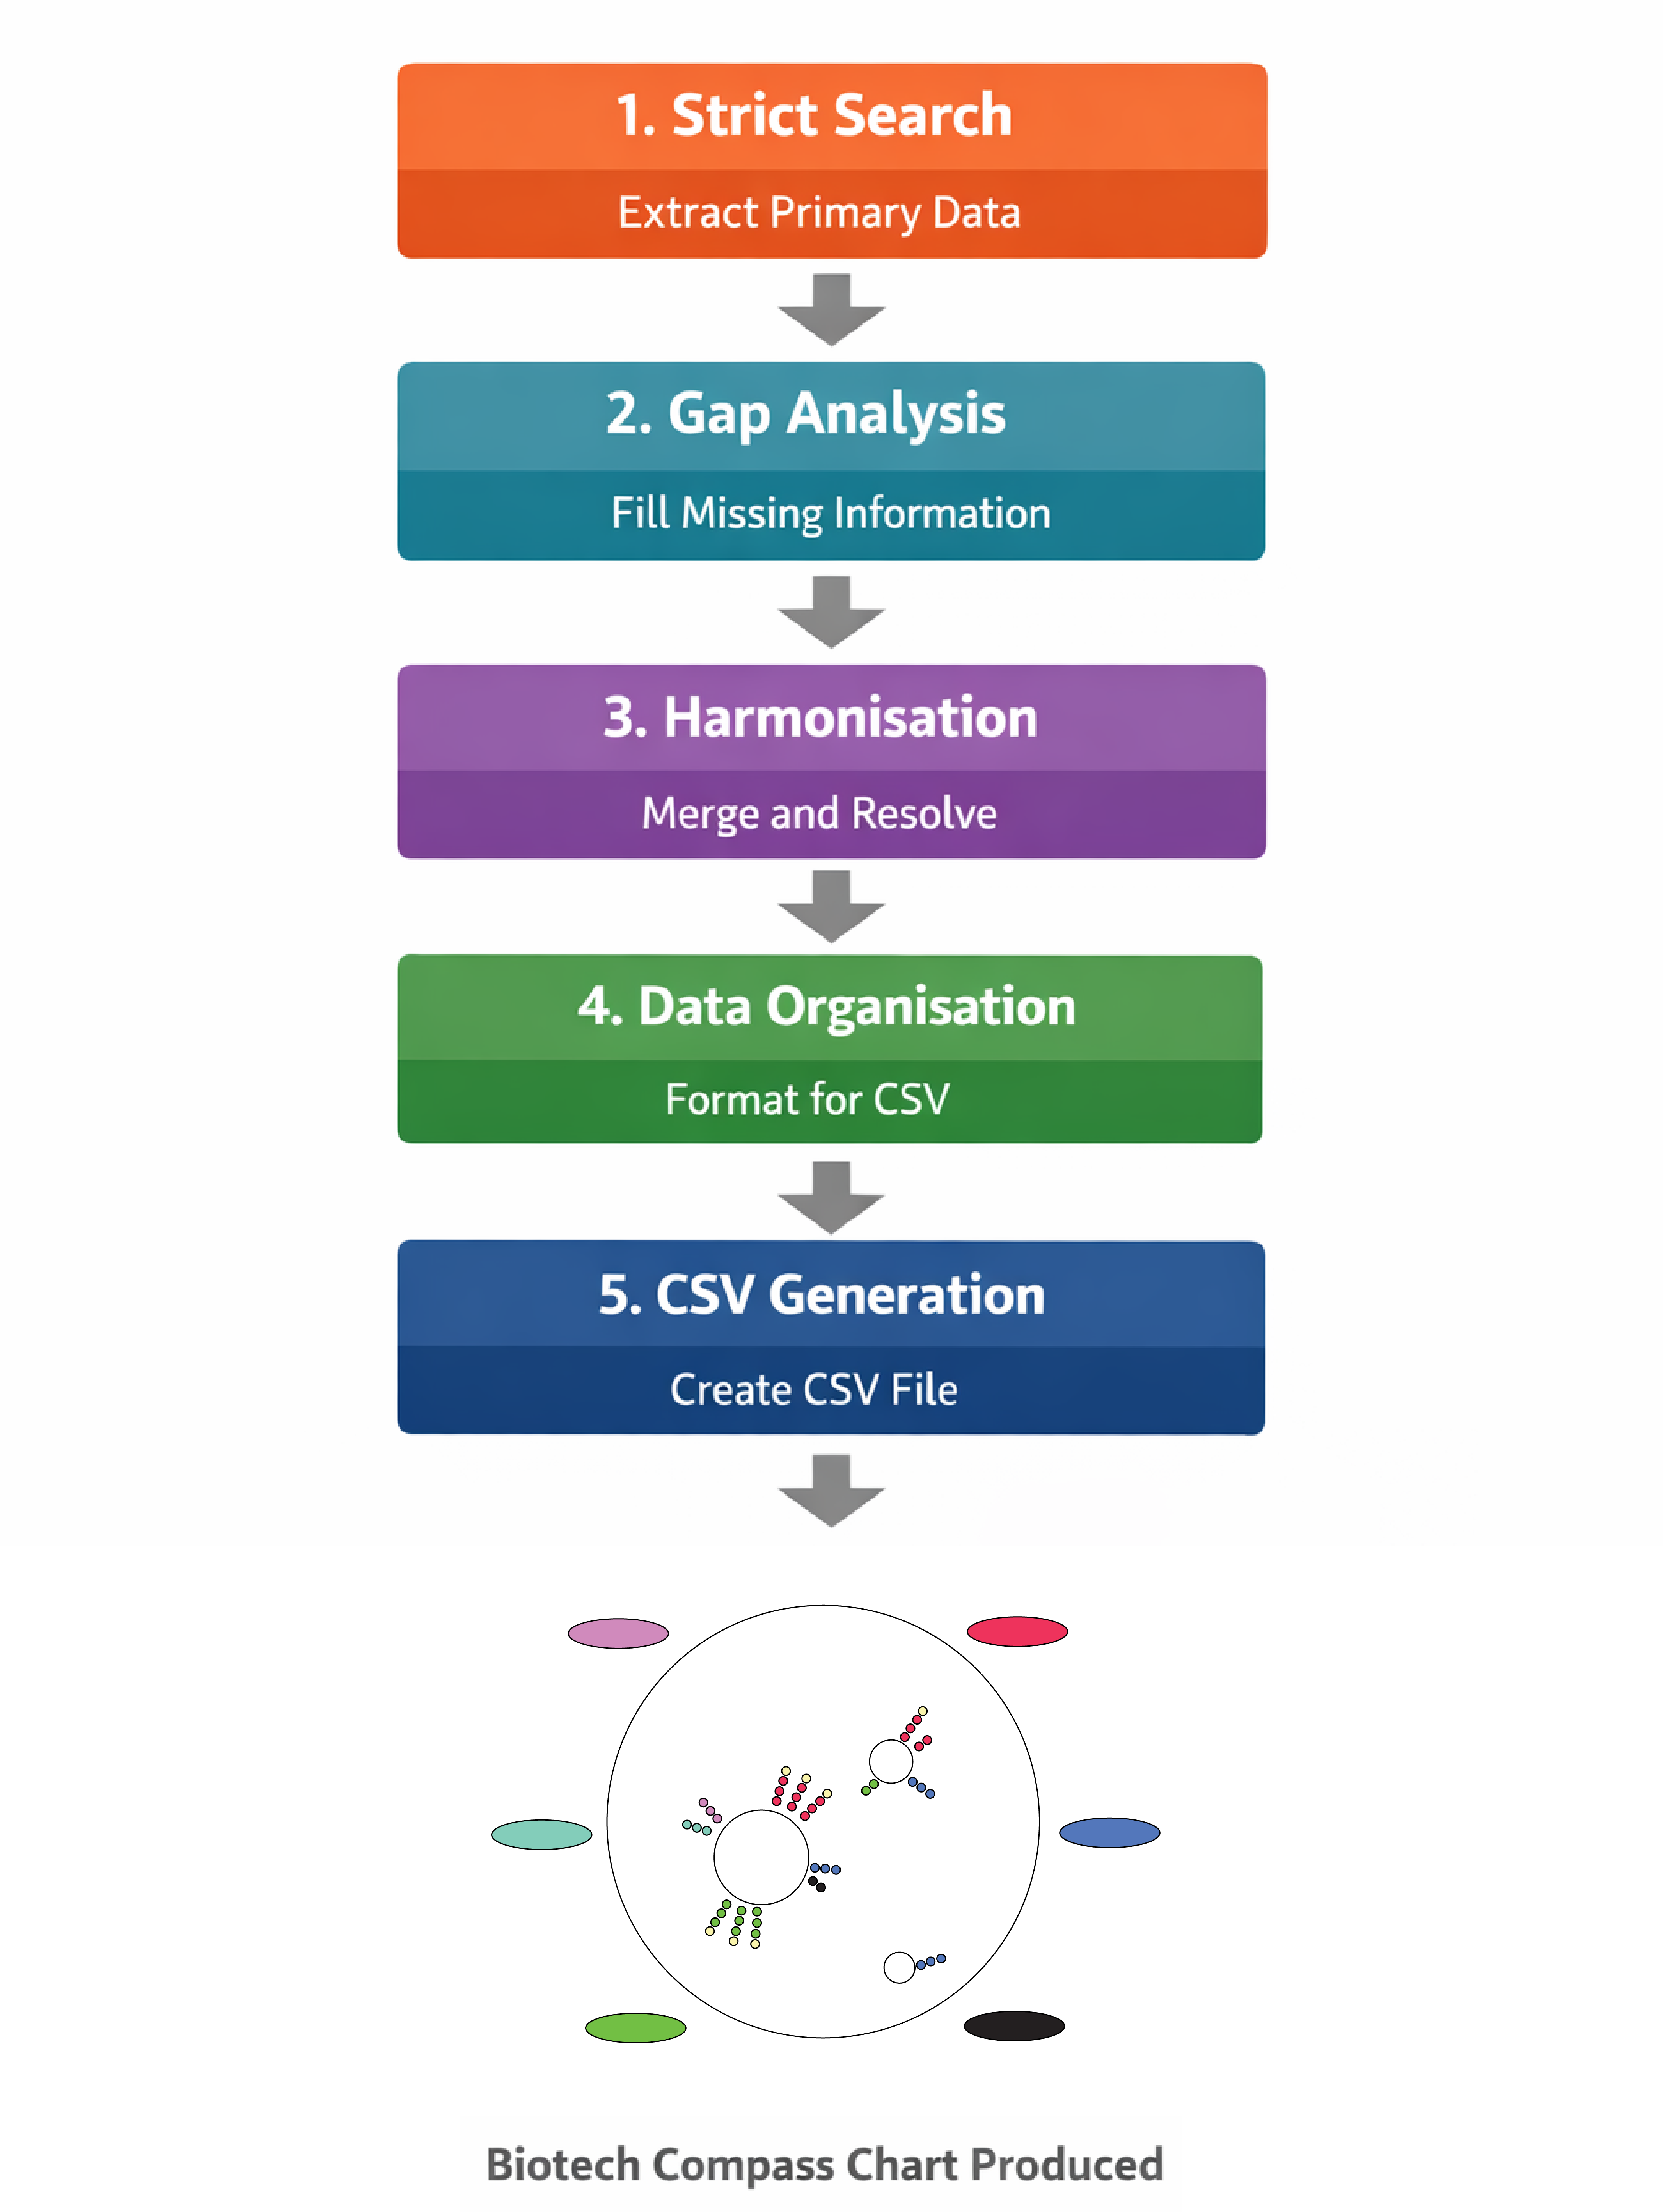
Each stage of the pipeline generates a resource document:
Strict Extraction (text file)
Gap Analysis (text file)
Harmonised Summary (text file)
Organised Data (text file)
CSV (.csv file)
You can feed the outputs back into ChatGPT to convert them into readable briefing notes, magazine-style articles, data tables, or any format you find easiest to read.
For an example of the Readable Briefings using the run described above ($BEAM, $KNSA, $PTCT, $VKTX, and $GOSS) see the Readable Briefings article below:
Or, to see the raw output files, follow the link below:
Final Note
I hope the Biotech Compass makes biotech research easier and more accessible for you. I'd love to hear from users about their experience. If you've found this useful, please share it or consider becoming a subscriber. My goal is to get this free tool into the hands of as many retail investors as possible.
The Biotech Compass has been a two-month project aimed at overhauling how we research and analyse biotech companies. If you’ve found this tool useful or it has helped your own research, consider becoming a paid subscriber to my Substack.
I work on this independently and in my own time, so financial support helps me continue writing articles and developing tools like this. While Biotech Compass v1.0 will remain freely available to all subscribers, paid subscribers will receive access to future patches and upgrades, as well as additional tools and deeper-dive analyses as the project evolves.
Please feel free to get in touch with any questions or suggestions.
Contact
I look forward to feed back on the Biotech Compass. If you wish to get in touch, you can contact me via:
Substack: thepharmafox.substack.com
Email: contact@thepharmafox.com
© 2026 The Pharma Fox. All rights reserved.
The codes and accompanying prompts associated with the Biotech Compass are provided for personal use by individual subscribers only. Redistribution, sharing, publication, or commercial use - in full or in part - is not permitted without prior permission. No reposting or mirroring of the prompts/code (including in other newsletters, GitHub repos, or prompt libraries).
All prompts, code, and figures remain the intellectual property of The Pharma Fox.
For educational purposes only. Not investment advice. You are responsible for verifying outputs against primary sources.
super cool! Next thing would be to build something similar to sleuthinsights! Willing to help if needed