
The Biotech Compass: Practical Run Guide
A step-by-step guide to running the Biotech Compass from company tickers to an intuitive output


Biotech investing should be for everyone, but it can be really difficult to keep up with the field.
Below, I outline an AI-driven workflow that produces intuitive charts and fully sourced documents to help streamline your biotech research.
For more details on The Biotech Compass, see the Biotech Compass Hub - all Biotech Compass Resources can be found here:
To run The Biotech Compass yourself, all the prompts and code you need can be found here:
What is the Biotech Compass?
The Biotech Compass is a visual chart designed to help investors get up to speed on trending biotech companies.
This tool helps you make sense of tickers you see mentioned online, and investigate them quickly and reliably without drowning in 10-Ks, press releases, or paywalled articles.
In brief, the Biotech Compass:
Is a complete research pipeline for analysing 3-5 biotech companies in parallel
Converts scattered data (SEC filings, FDA databases, clinical trials) into structured, comparable output
Produces fully sourced extractions, easy to read company overviews and a signature visual chart
Promotes comparative analysis:
e.g. if you are lost in all the AAV vectors or GLP-1–focused pipelines - run themed companies together to build a picture of the competitive landscape; not just single companies.
However, The Biotech Compass:
Is not investment advice or a stock-picking system
Does not replace due diligence: it’s the starting point
Is not a ‘set and forget’ tool: gaps and conflicts demand further investigation – stimulating self-directed research
Time investment:
In around 30 minutes, you can generate a readable, structured snapshot of up to five biotech companies, supported by a signature chart and pipeline tables.
In less than an hour, the Biotech Compass can bring you up-to-speed on companies you are interested in, highlighting pipeline breadth, diversity and risk profile.
Step-by-Step Guide
1. Logic Behind the Compass
The Five Prompts
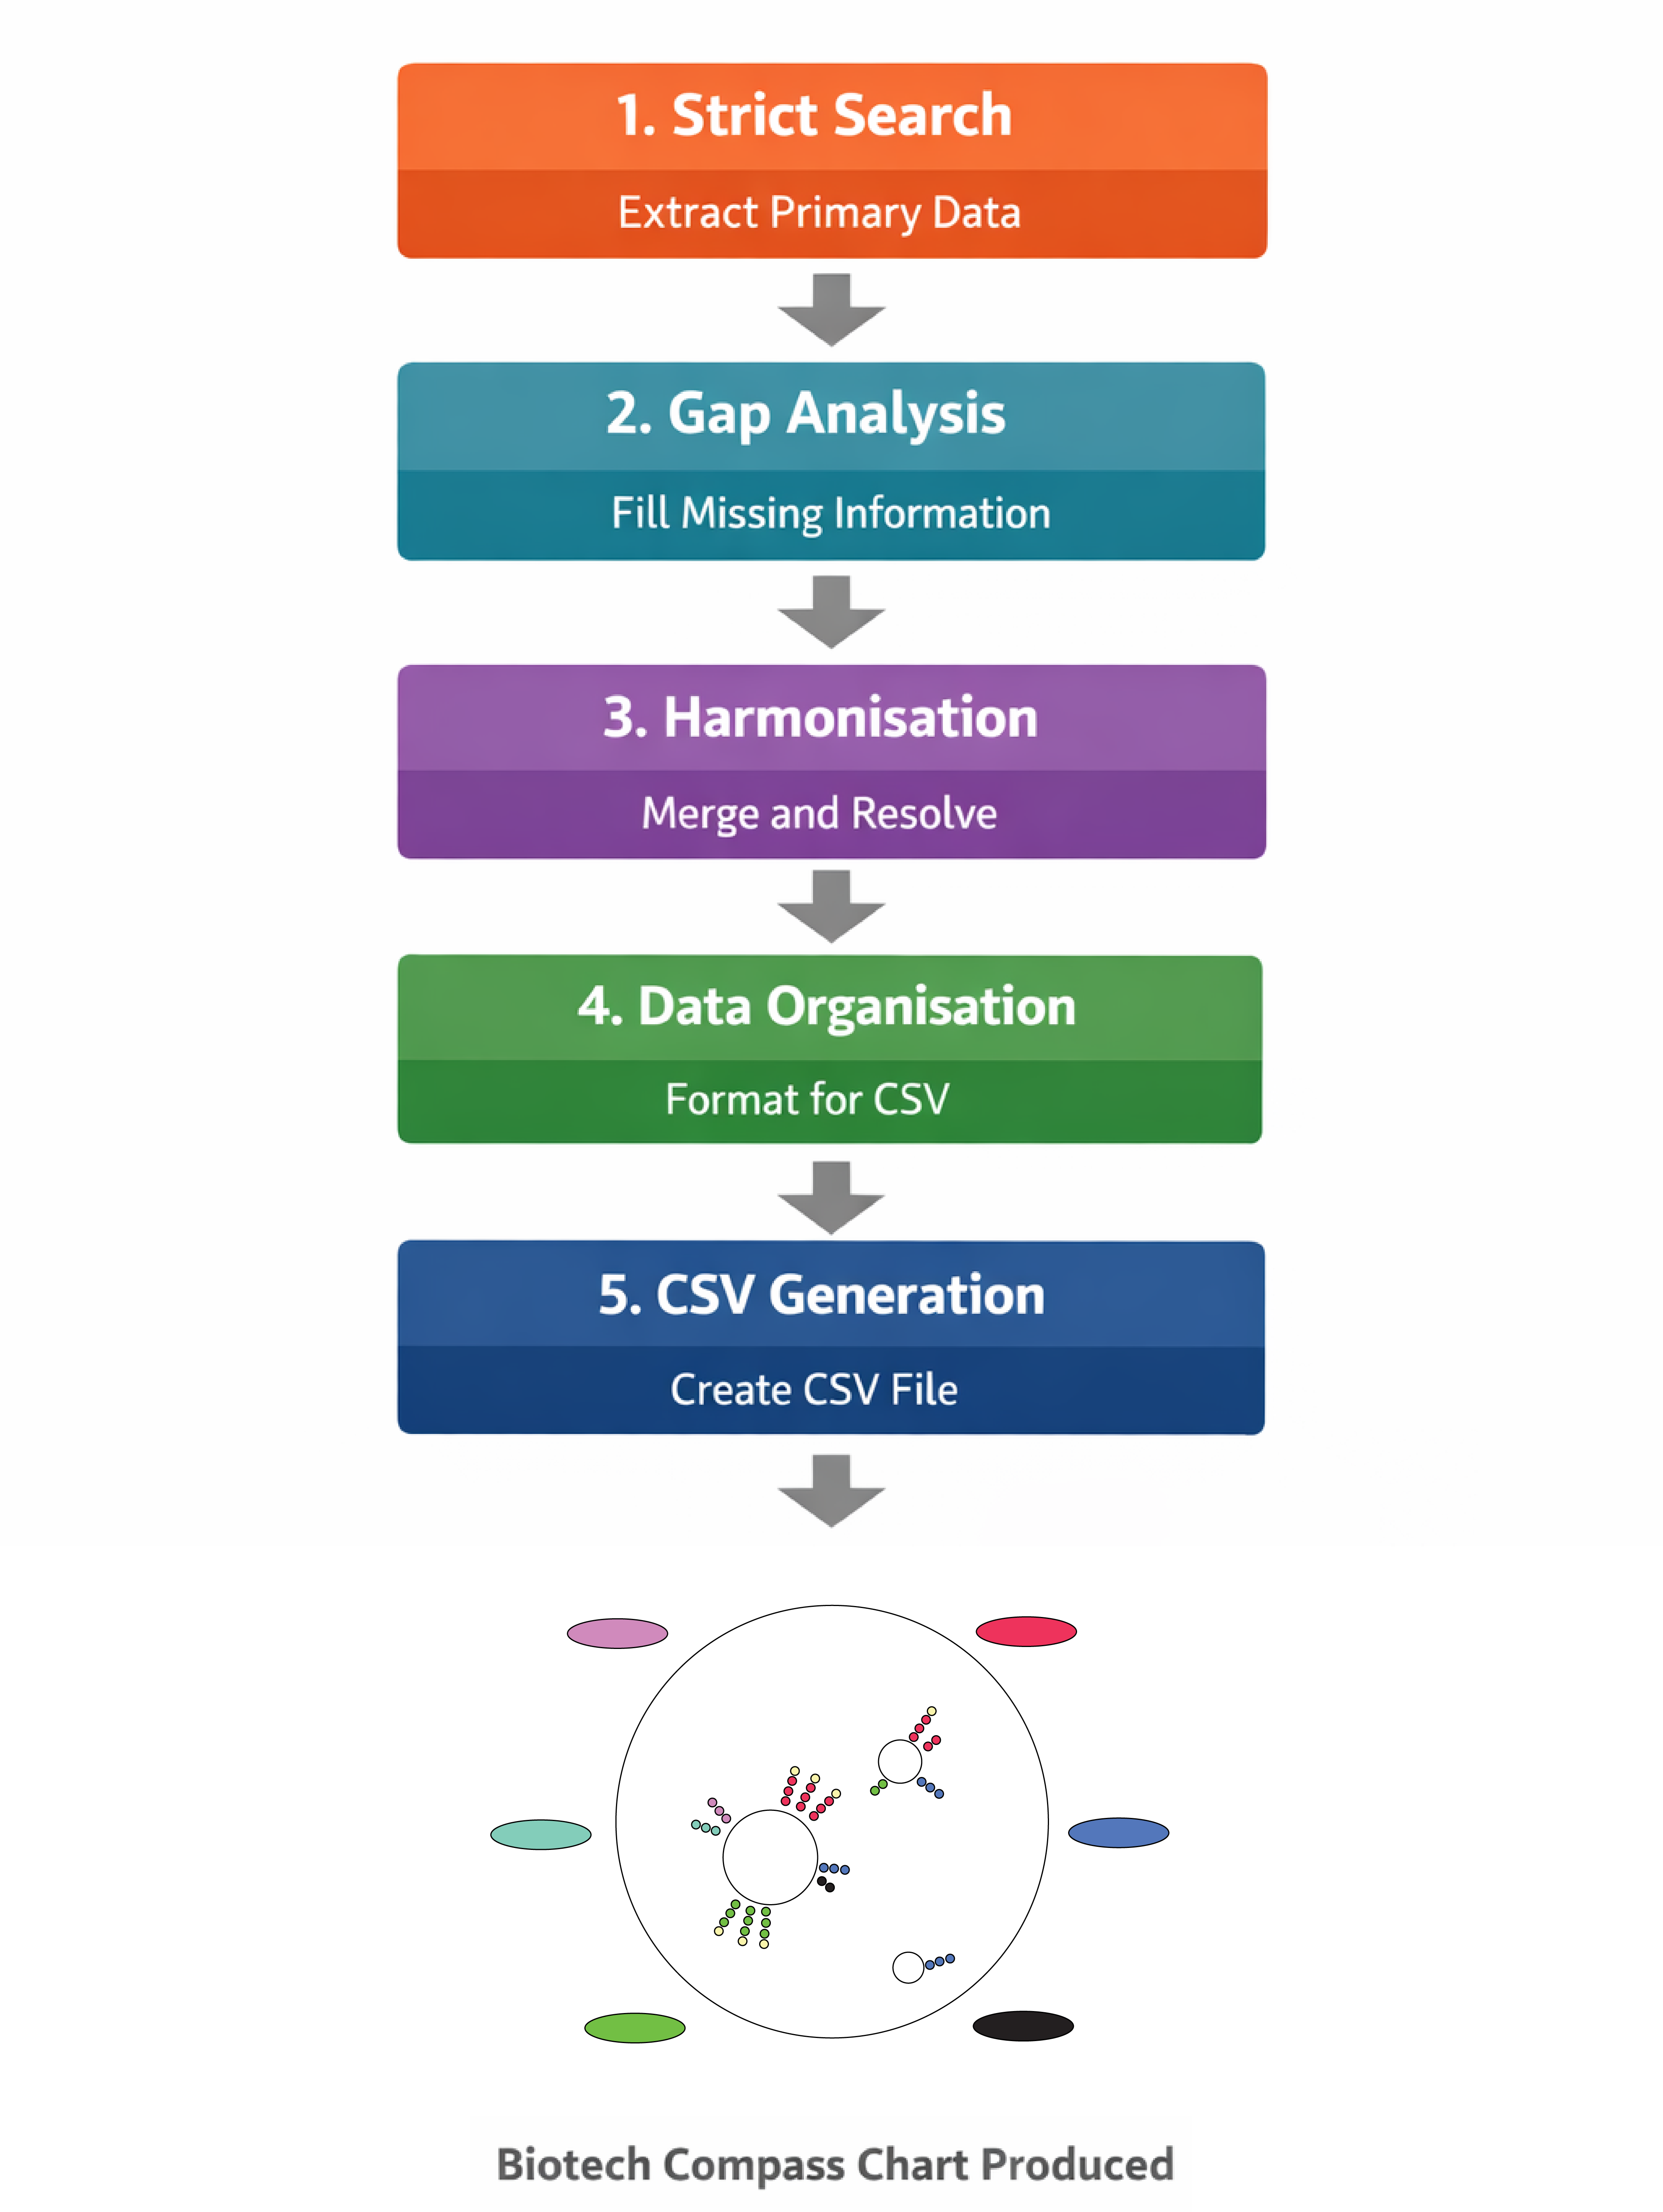
What each prompt is doing:
Prompt 1 - Strict Search
Purpose: Curates high-quality data from primary sources
Sources: Company websites, SEC filings, FDA databases, and ClinicalTrials.gov only
Restrictions: Explicitly prohibited from using secondary sources
Output: Produces a fully sourced, factual extraction of your chosen companies
Handling gaps: Missing information is explicitly logged – inference and hallucination are prohibited
This forms the ground truth for all downstream analysis.
Prompt 2 - Gap Analysis (Open Web)
Purpose: Searches the entire web for information that could fill gaps found in the strict search (e.g clinical phases, pipeline completeness, or current news)
Sources: Secondary news sources, analysis and finance websites, press releases and disease-specific websites (e.g www.hda.org.uk)
Restrictions: Explicitly prohibited from inference and hallucination
Output: Anything missing from Prompt 1, complete with sources
Conflicts: Any new findings that clash with the Strict Search are logged for downstream analysis – Prompt 2 cannot overwrite prompt 1 output
This builds the narrative picture of the company
Prompt 3 - Harmonisation
Purpose: To merge the curated data from prompts 1 and 2
Sources: The output files from Prompts 1 & 2
Restrictions: Explicitly prohibited from adding additional information – may only use the additional materials to contextualise data
Decision Making: Strict data takes precedence over gap data
Resolves conflicts, standardizes taxonomy
Output: A single comprehensive document on your companies of interest
This is the authoritative dataset for downstream tables and charts
Prompt 4 – Organisation
Purpose: Structures the harmonised data for tables and CSV
Sources: The output file of Prompt 3
Formats disease areas, modalities and phases consistently
Output: A structured dataset ready to populate a CSV file
This is the source of tabularised output form the Biotech Compass
This is the organised data for downstream visualisation
Prompt 5 - CSV Generation
Purpose: To convert the organised dataset into a CSV file
Ready to feed into the chart code
Output: A single CSV file that can be immediately uploaded to Google Colab
This is the final output of the Biotech Compass prompts.
2. What You Need: Prerequisites
ChatGPT account (Plus recommended for reliability, but free tier works)
Google Colab account (free)
No coding capacity – just copy, paste and follow the instructions
3-5 biotech company tickers you want to analyse
What you will produce:
4 text file outputs (Strict -> Gap -> Harmonised -> Organised)
1 CSV file
1 compass chart visualisation
Optional: AI-formatted readable briefings (articles and tables)
Note on picking companies:
You can run any biotech companies together that you like (5 tickers that you want to investigate), however I find it valuable to perform themed runs: e.g AAV centred gene therapies, platform companies, GLP-1 agonists etc
3. Preparation
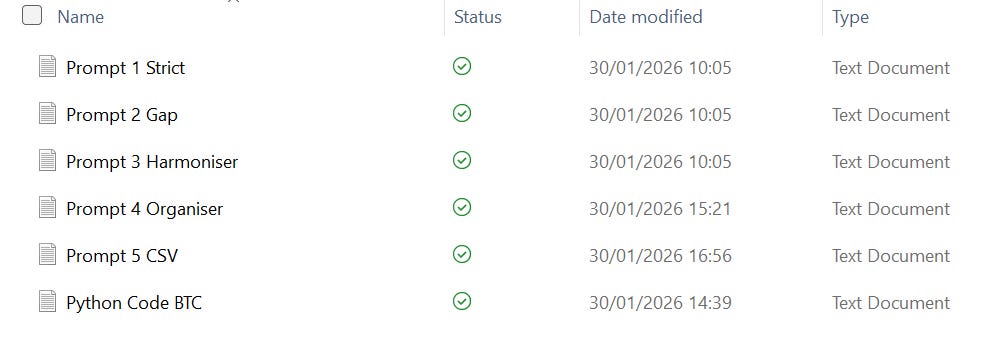
Set Up Your Working Directory
To keep track of output files and maintain a clean record of prompts and code, start by preparing a working directory for each Biotech Compass run.
I typically create a top-level folder named after the run ID, which includes the date of analysis.
Within this folder, I create two subfolders:
output files: for all generated documents, tables, charts, and summaries
codes and prompts: for the prompts and Python code used in that run
This keeps everything related to a single run in one place and makes it easy to revisit or reproduce the analysis later.
I store all prompts and code as plain text files. If you’re using my prompts, I recommend copying them directly from my Substack (linked) into text files and saving them in the codes and prompts folder within your Biotech Compass working directory.
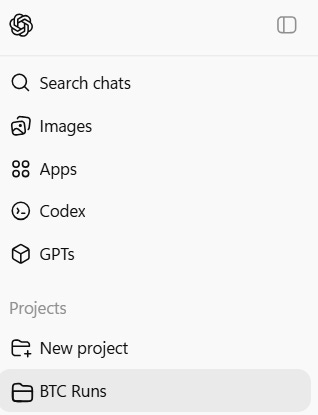
It is also useful to set up a new project folder on ChatGPT to keep all your Biotech Compass runs.
Preparation: Organise Your Search List
Write down 3–5 tickers you want to analyse.
That’s it!
It’s worth keeping a simple log (for example, a plain text file) of the companies you’ve searched and the dates you ran them.
4. Running the Pipeline
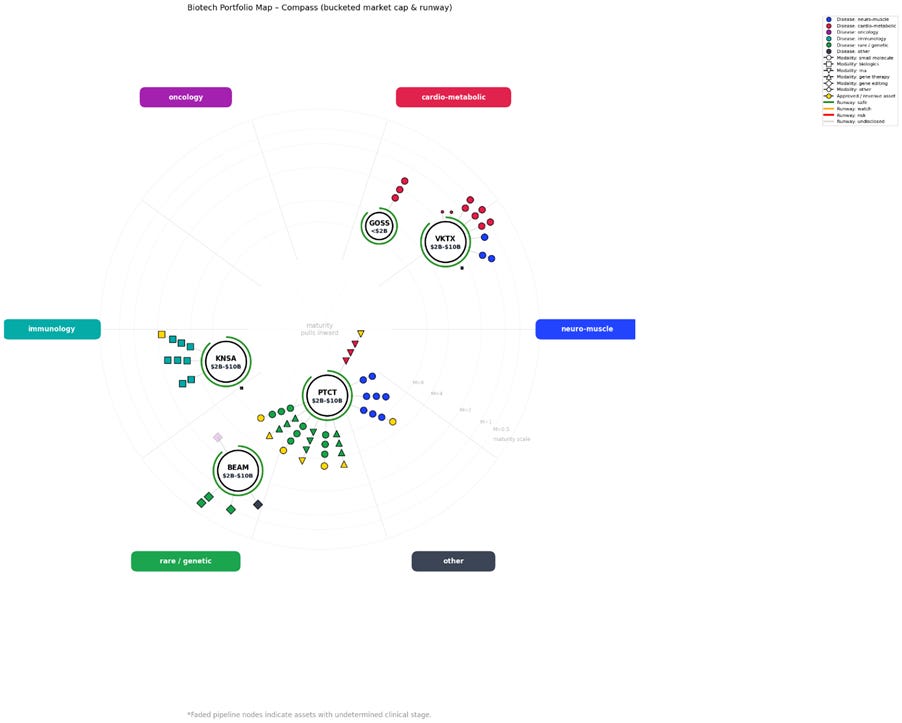
In this walkthrough, I will be referring to a run I performed on the 2nd of February 2026 looking at Beam Therapeutics (BEAM), Kiniksa Pharmaceuticals (KNSA), PTC Therapeutics (PTCT), Viking Therapeutics (VKTX) and Gossamer Bio (GOSS).
I recommend performing your own pilot run using these companies. However, the output of each run will vary due to controlled inference in the system and more recent company disclosures.
I have catalogued the output of each prompt in this Biotech Compass: Raw Output article. Have a look at the raw output of a Biotech Compass run and compare your output to mine.
4.1 Prompt 1 – Strict Extraction
Instructions
1. Open ChatGPT and begin a new chat
2. Copy Prompt 1 from here or from your save text file
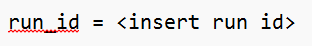
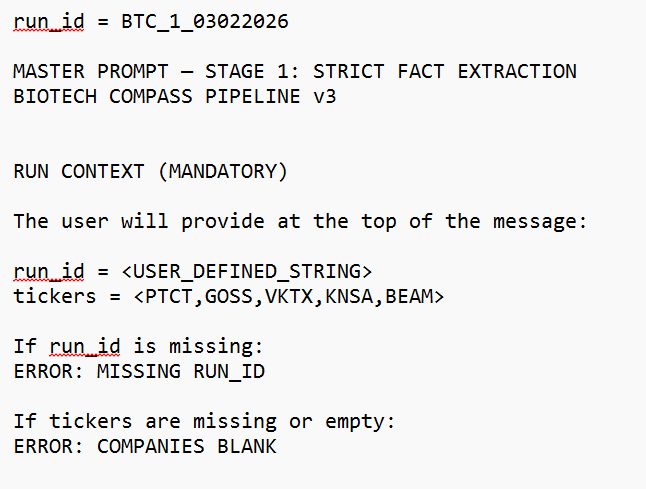
3. Manually add a ‘run id’ – I recommend keeping it simple but including the date
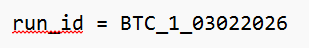
Becomes:
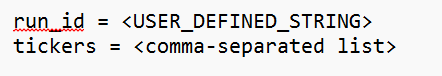
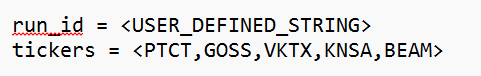
4. Replace placeholder tickers with your companies
Becomes:
Your prompt should now look like this:
5. Run the prompt
6. Wait 2-5 minutes
7. Download the output text file and save to your working directory: [your_run_id]__strict_extraction.txt
This is the first data output of the Biotech Compass – from here we will refer to it as the Strict Extraction (1)
Have a look at my Strict Extraction file for the companies listed above here
What is the Strict Extraction (1) document?
A fully sourced data extraction using only primary sources
Organised by company
Data includes pipeline assets, clinical phases, disease indications, revenue statements, and signals detected (e.g. PDUFA dates, CRLs, RMAT designations, BLA/NDA submissions)
Logs conflicts and confusion where information from one source does not align with another
Logs missing information where required data for the chart could not be identified through this search
The Strict Extraction (1) serves as the input for Prompt 2: Gap Analysis
Troubleshooting:
· If output is completely empty for a company, check the ticker used is correct
· If a run fails, ensure you have correctly added a run_id
4.2 Prompt 2 – Gap Analysis
Instructions
1. Copy Prompt 2 from here or from your text file
2. Manually insert the same run_id
3. Attach the Strict Extraction (1) file as an input
4. Run the prompt
5. Wait 2-5 minutes
6. Save the output text file to your working directory: [your_run_id]__gap_analysis.txt
This is the second data output of the Biotech Compass – from here we will refer to it as the Gap Analysis (2)
Have a look at my Gap Analysis for the companies listed above here
What is the Gap Analysis (2) document?
The gap analysis logs relevant data not identified in the strict extraction
Conflicts between the strict extraction and the gap analysis are explicitly recorded
What to Do with Conflicts
The Gap Analysis functions as a secondary web search layer. Any conflicts between sources are preserved rather than resolved, allowing you to manually investigate them if needed by referring back to the Gap Analysis file.
Failure Modes:
The run will automatically fail if a run_id or the Strict Extraction (1) document are not provided.'
4.3 Prompt 3 – Data Harmonisation
Instructions
1. Copy Prompt 3 form here or from your text file
2. Input your run_id
3. Provide both Prompt 1 AND Prompt 2 outputs as input -
Strict Extraction (1) and Gap Analysis (2)
4. Save the output text file to your working directory [your_run_id]__harmonised_summary.txt
This is the third output of the Biotech Compass – Harmonised Summary (3)
Have a look at my Harmonised Summary for the companies listed above here
What is the Harmonised Summary (3) document?
This is a merged dataset combining the Strict Extraction (1) and Gap Analysis (2) to form a single, most-likely coherent narrative for each company.
Data from the Strict Extraction is prioritised, with gaps selectively filled using the Gap Analysis.
The aim is to strike a balance between producing the most complete and up-to-date picture of a company while maintaining source discipline and information rigour.
This document contains all the information which will eventually populate the Biotech Compass Chart.
Good Practice:
When researching a company further, reviewing conflicts identified in the Gap Analysis (2) and how they were resolved in the Harmonised Summary (3) is a useful starting point.
Failure modes:
The run will automatically fail if a run_id or the Strict Extraction (1) document and Gap Analysis (2) are not provided.
4.4 Prompt 4 – Data organisation
Instructions
1. Copy Prompt 4 from here or from your text file
2. Enter your run_id
3. Inputs: Provide Prompt 3 output (Harmonised Summary (3)) as input as well as the Python Code for generating the Biotech Compass Chart (here)
4. Save the output text file to your working directory: [your_run_id]__organised_data.txt
This is the fourth output of the Biotech Compass – Organised Data (4)
Have a look at my Organised Data for the companies listed above here
What is the Organised Data (4) document?
The Organised Data organises the Harmonised Summary (3) into the categories required for the Biotech Compass chart.
Each company’s assets are structured with all necessary attributes (disease area, drug modality, clinical phase, etc.).
This dataset is then ready for conversion into a CSV in Prompt 5.
*Note: Adding the Python Code as in input document at this stage helps to keep the LLM focused and reduces the likelihood of introducing new and incompatible categories. It should be converted to a .txt file of any name and attached to the prompt.
Failure modes:
The run will automatically fail if a run_id or the Harmonised Summary (3) document and Python Code are not provided.
4.5 Prompt 5 – CSV Generation
Instructions
1. Copy Prompt 5 from here or from your text file
2. Input your run_id
3. Provide Prompt 4 output (Organsied Data (4)) as input
4. Save the output CSV file to your working directory [your_run_id]__biotech_compass.csv
This is the fifth output of the Biotech Compass – CSV (5)
Have a look at my CSV for the companies listed above here
What is the CSV (5) document?
A CSV file with the following headers:
ticker (company ticker)
company_name (full name of company)
market_cap_bucket (can be only ‘<$2B’, ‘$2B-$10B’, ‘>$10B’)
cash_runway_bucket (can be only ‘safe’, ‘watch’, ‘risk’)
drug_name (full name of drug)
indication (can be any specific disease details)
disease_area (can be only ‘oncology’, ‘immunology’, ‘neuro-muscle’, ‘cardio-metabolic’, ‘rare / genetic’, or ‘other’)
modality (can be only ‘small molecule’, ‘biologics’, ‘gene therapy’, ‘rna, ‘gene editing’, or ‘other’)
modality_detail (can be any specific drug details)
phase (can be only ‘0’, ‘1’, ‘2’, ‘3’, or ‘blank’)
revenue (can be only ‘yes’ or ‘no’
Make sure column headers match expected format and data does not diverge from that detailed above
*Note: a clinical phase of ‘0’ indicates a preclinical asset; a blank clinical phase is dealt with by the Python Code and treated as undetermined.
5. Creating The Chart - Google Colab
This is the final step of the Biotech Compass, and it is the simplest. All you need is the CSV (5) output and the Python Code provided (here).
5.1 Open The Colab Notebook
1. Go to [https://colab.research.google.com]
2. Login with your Google credentials or create a profile here [https://myaccount.google.com/]
5.2 Upload Your CSV
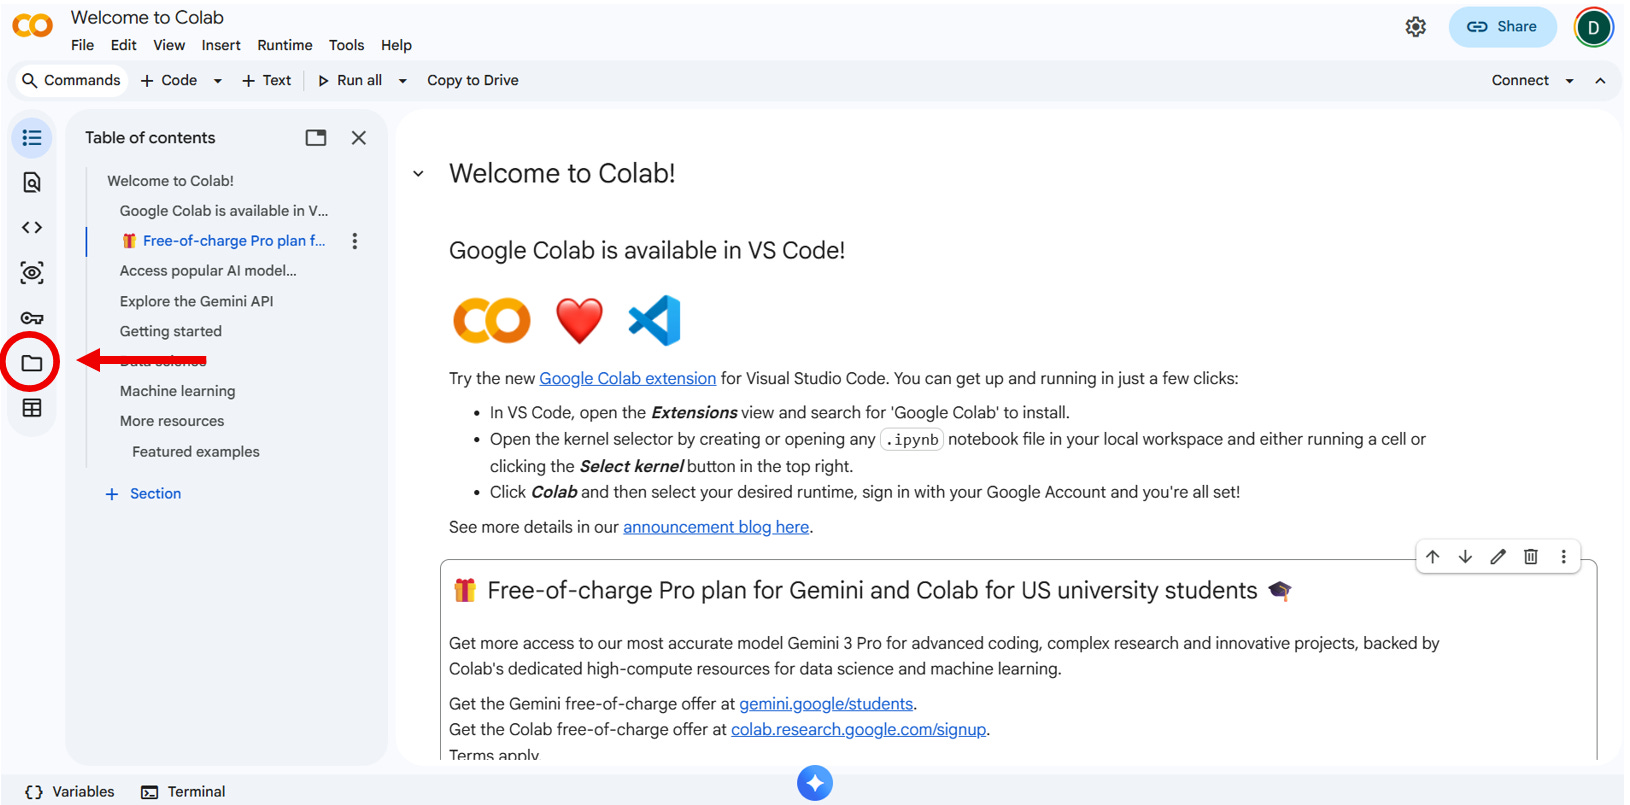
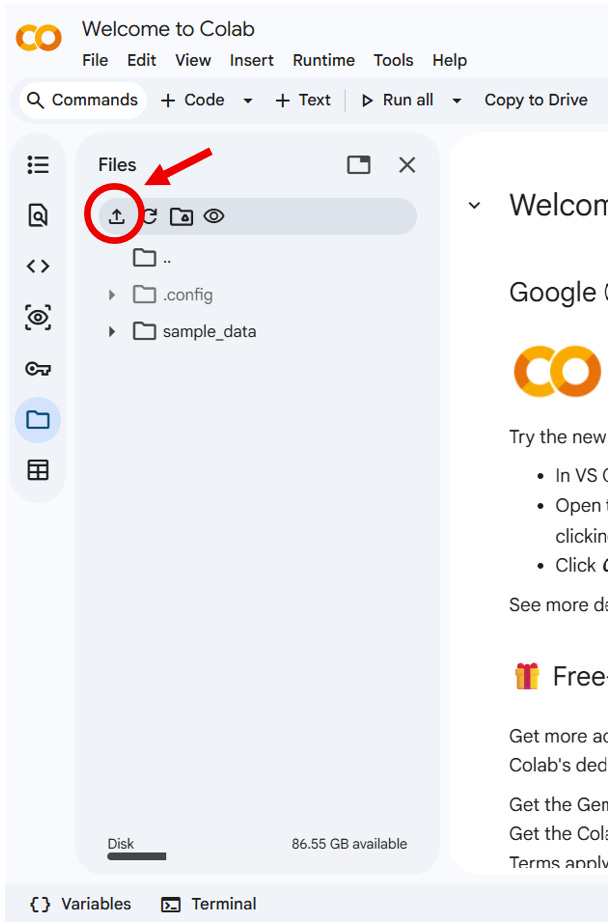
1. In Colab, click the folder icon on the left
2. Once the runtime has connected, upload [your_run_id]__biotech_compass.csv by clicking on the upload symbol and selecting the file from your working directory
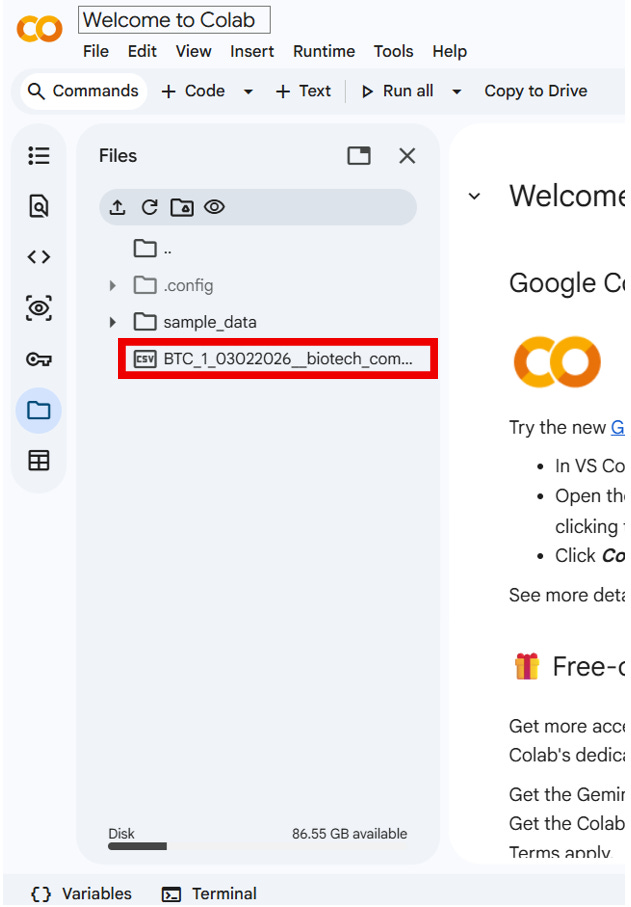
3. You will now see [your_run_id]__biotech_compass.csv uploaded in the runtime file system
5.3 Inserting the code
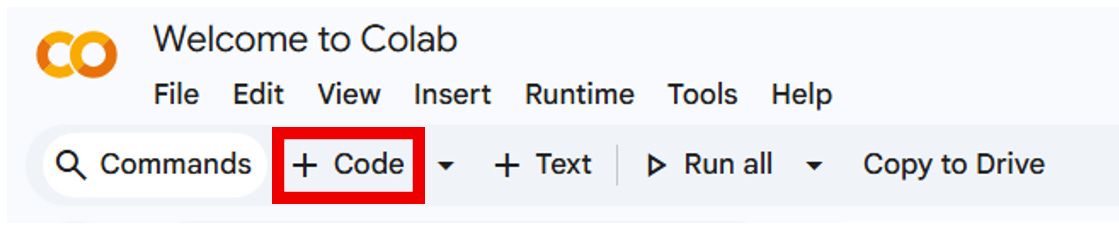
1. At the top of the page, click the ‘code’ button
2. A code cell will appear at the bottom of the page. Paste the Python code into this cell, either by copying it from my article or from your saved .txt file.
3. Once you have pasted in the code, scroll to the top of the code and change the file name to match the .csv file
This:
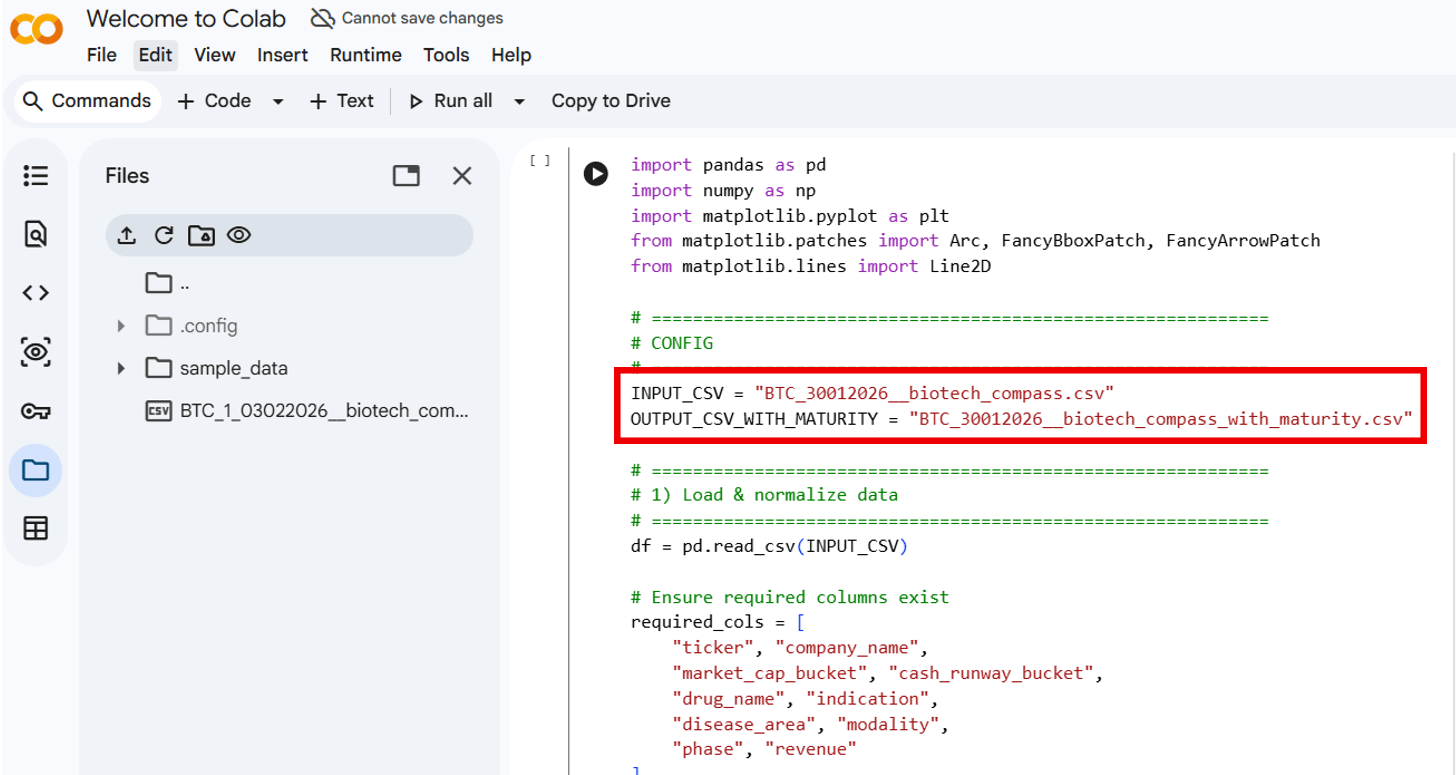
Becomes:
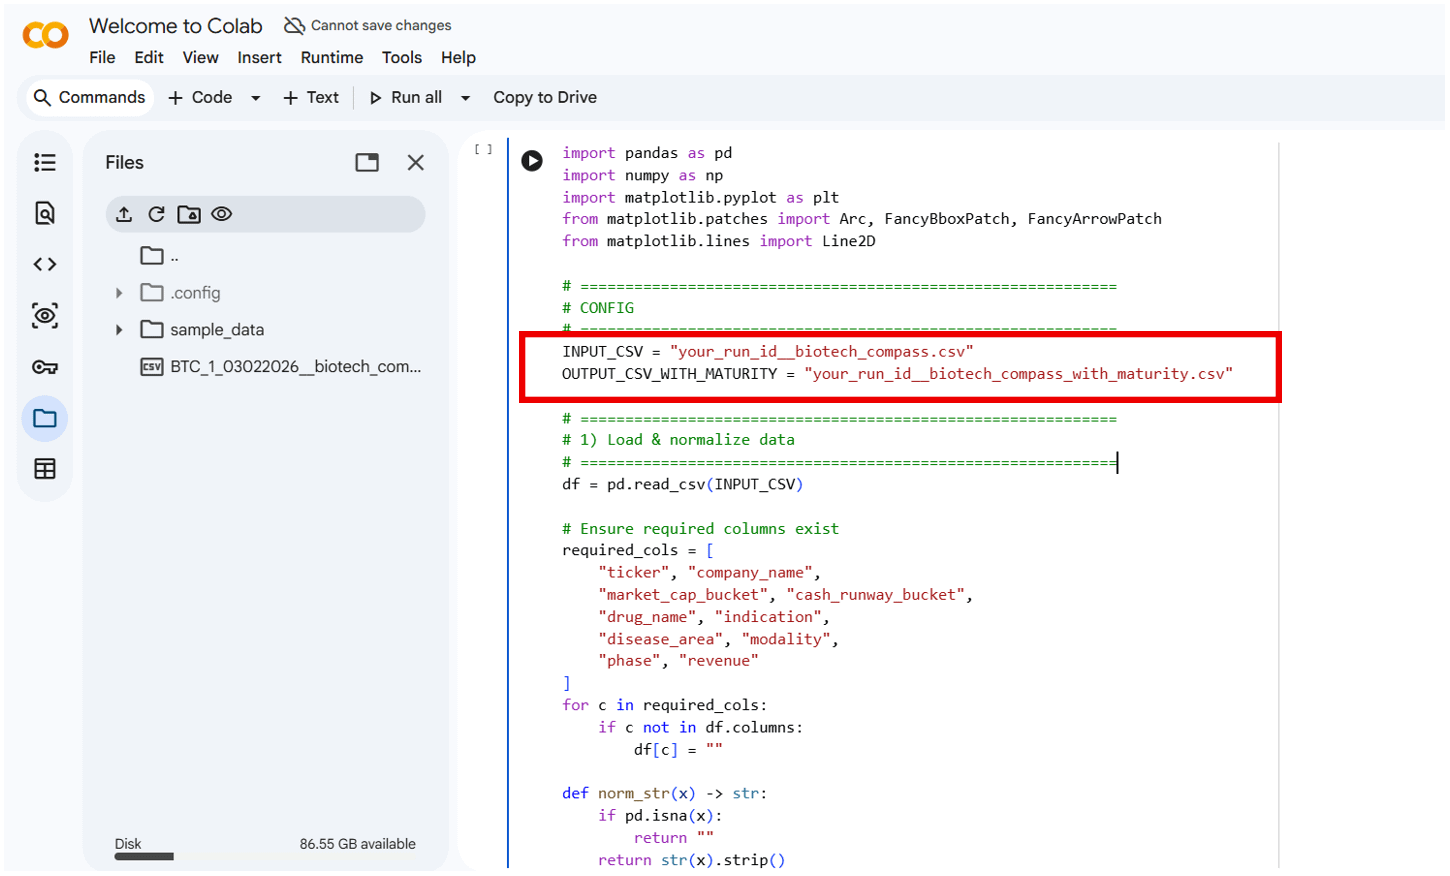
Note: The …with_maturity.csv file outputs an intermediate CSV containing the maturity score used to position companies on the Compass. You do not need to modify or use this file during normal operation; it is included purely for troubleshooting and inspection.
5.4 Run The Code
1. Click the play button
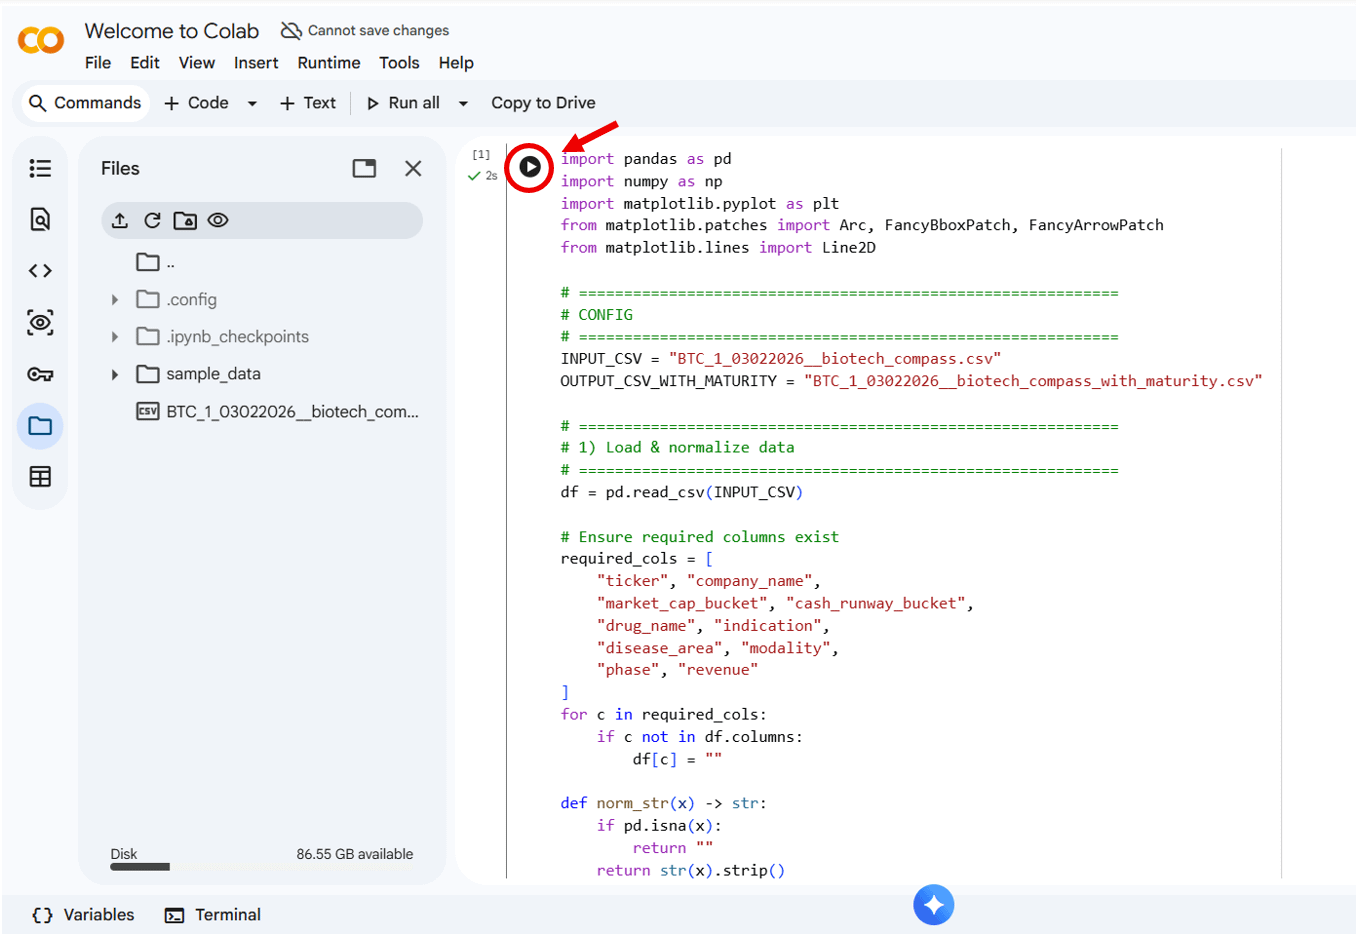
2. Wait ~5 seconds
3. The chart will appear at the bottom (scroll down)
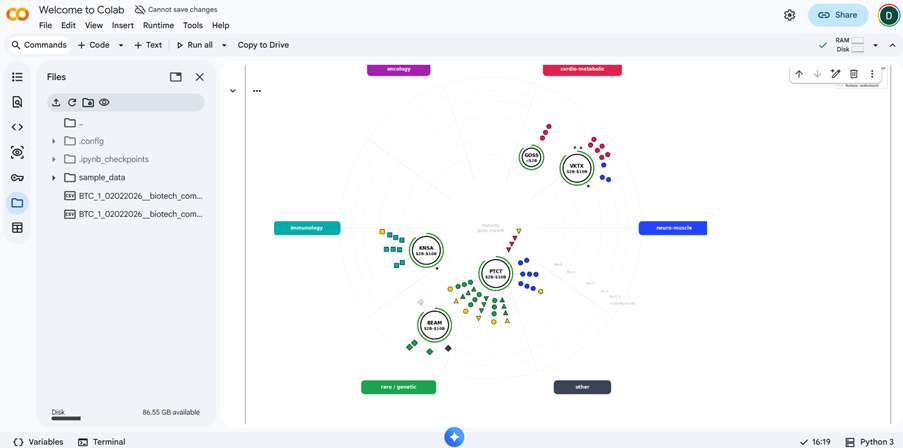
4. The chart can now be saved as a .png file in your working directory.
Failure Modes
If the filename in the code does not exactly match the CSV file you uploaded, the run will fail and throw an error. In practice, this is the only failure mode I’ve encountered when running the Biotech Compass.
6. Reading the Chart
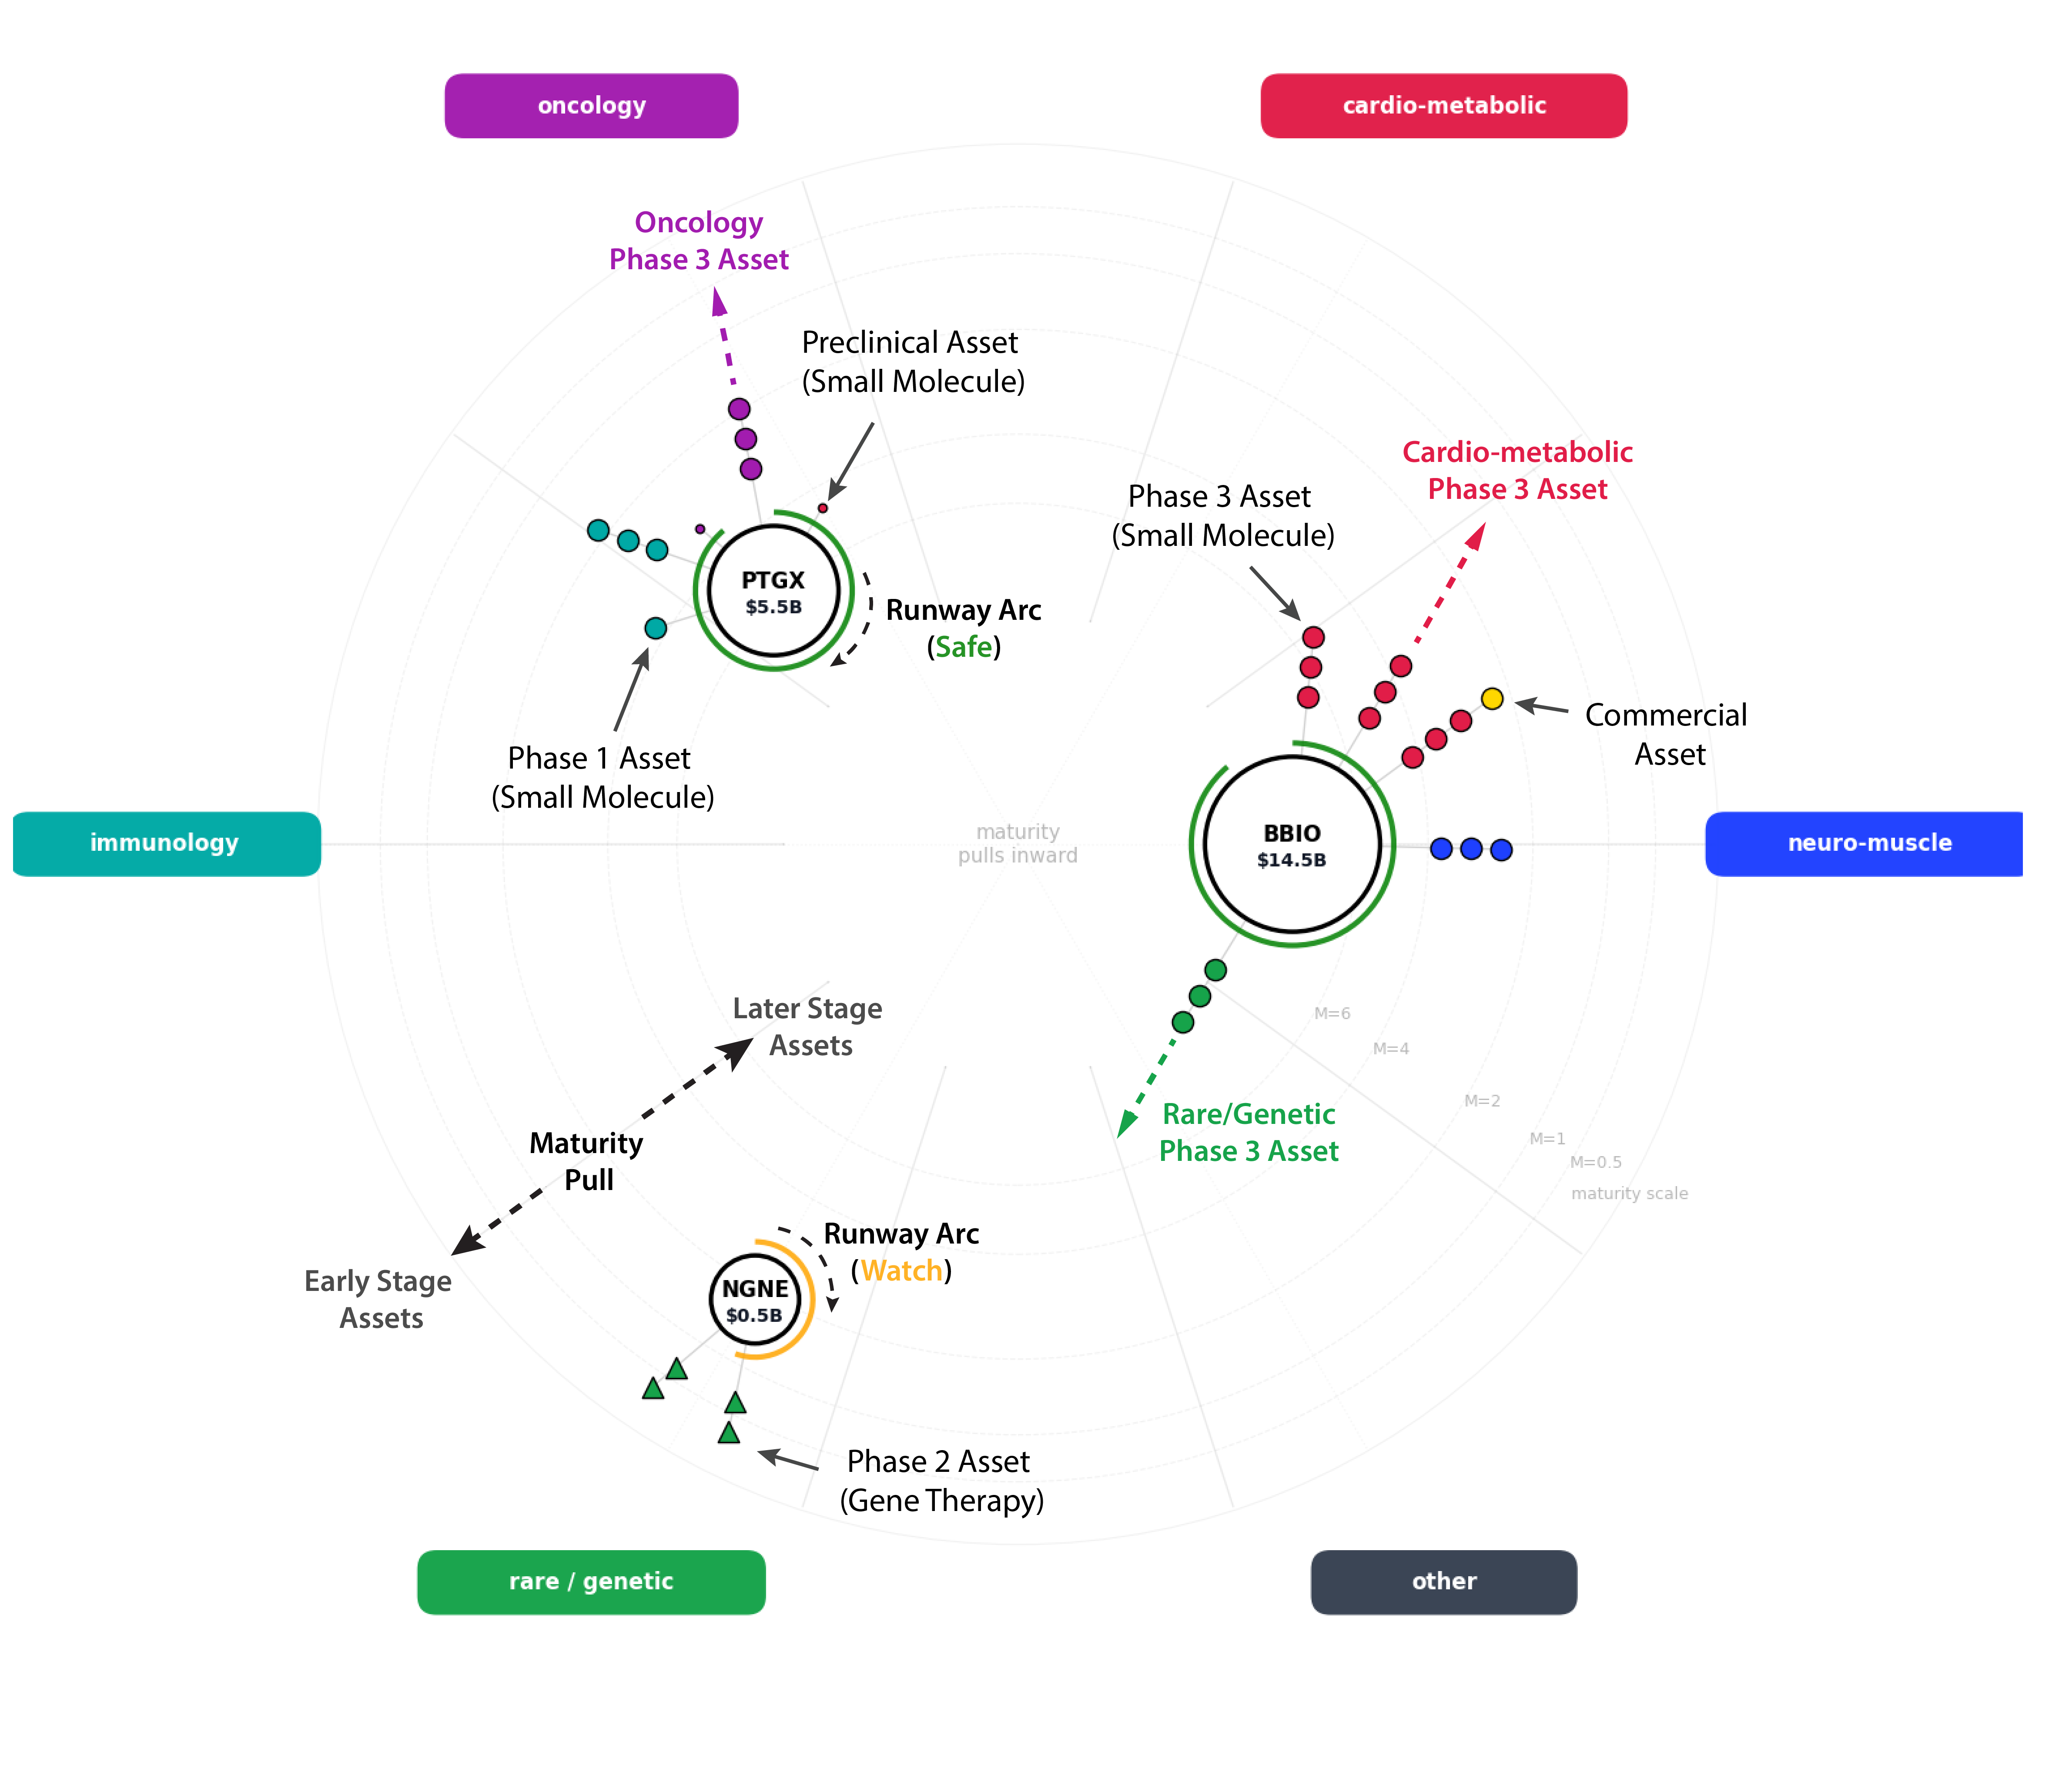
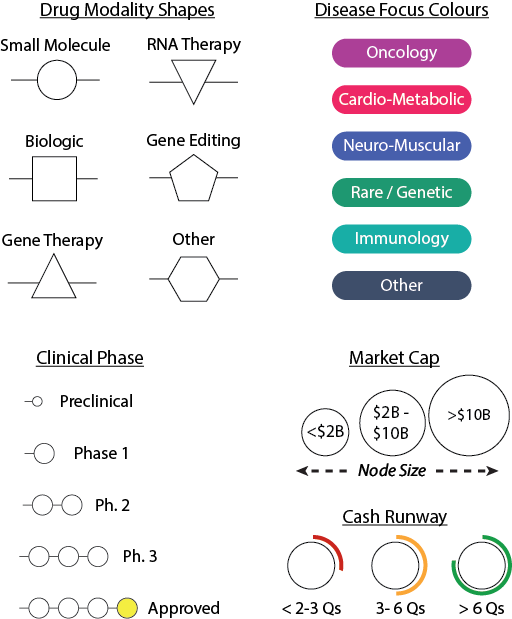
For full details of how to read the Biotech Compass Chart, see my Introduction to the Biotech Compass article. In brief, the chart displays seven core elements about each Biotech Company analysed:
Position (radial): Disease area (each capsule is a different disease)
Position (centre to edge): Pipeline Maturity (centre = more mature, edge = earlier stage)
Circle size: Market cap (<$2B, $2B-$10B, >$10B)
Arc colour around circle: Cash runway (green=safe, orange=watch, red=risk, grey=undisclosed)
Node shapes: Drug modality (circle=small molecule, square=biologics, etc. see legend)
Node colours: Disease area (matches the capsules around the chart)
Gold nodes: Approved/revenue-generating drugs
Lines radiating from company circles: Asset maturity (1 node = Phase 1, 2 = Phase 2 etc.)
6.1 What to Look For
The Chart will show you key information but also will show you what is missing or doesn’t fit the chart well. Often these can be the most intriguing follow-up questions.
Clustering: Do companies group together? This may suggest overlapping profiles or competition
Outliers: Is one company way off from others? This may imply a different risk profile or stage
Maturity spread: Are they all early-stage or is there a mix?
Runway concerns: Any red arcs? Is cash burn risk? If so, why?
Pipeline density: Lots of nodes indicates a diverse pipeline, but a single node suggests dependence on a single asset
6.2 What the Chart Highlights
A brief analysis of the chart shown above, analysing KNSA, GOSS, VKTX, PTCT, and BEAM
PTC Therapeutics (PTCT) stands out as a much more mature and diversified company than I initially appreciated. It has a broad, well-developed pipeline spanning small molecules, gene therapies, and RNA-based drugs, targeting neuromuscular, rare genetic, and cardio-metabolic conditions. A large proportion of its assets are revenue-generating, placing PTCT firmly in the category of a commercial-stage biotech transitioning toward a stable mid-cap profile.
By comparison, Beam Therapeutics (BEAM) and Viking Therapeutics (VKTX) have earlier-stage pipelines, with most assets in Phase 1 or Phase 2 and no immediate path to commercialisation. These companies remain primarily development-stage, with value driven by future clinical catalysts rather than current revenue.
Kiniksa Pharmaceuticals (KNSA) sits between these two extremes. It has one commercialised asset, another in Phase 3, and a further program in Phase 2, with a clear focus on biologic therapies. This gives KNSA a degree of revenue stability while retaining meaningful upside from pipeline progression.
At the other end of the spectrum, Gossamer Bio (GOSS) appears to be a single-asset company, centred on a small-molecule drug in Phase 3. As expected, this translates into a smaller market capitalisation and a much more binary risk profile.
Interpreting This from an Investing Perspective
From an investing standpoint, the chart immediately highlights different company archetypes and risk profiles:
An investor seeking a growth-oriented mid-cap might be drawn to PTC Therapeutics, where pipeline diversity and existing revenue suggest a degree of stability alongside continued expansion potential.
Viking, Kiniksa, and Beam represent companies that are not reliant on a single asset, but are still catalyst-driven, with valuations likely to respond sharply to clinical successes or failures.
Kiniksa’s existing commercial asset may make it a comparatively lower-risk entry point, particularly for newer investors.
Gossamer Bio represents the most binary risk: a potential moonshot or a sharp decline tied to a single pivotal outcome. Depending on risk tolerance, this may be either attractive or off-putting.
The value of the chart is that it presents this comparative risk landscape upfront, before committing time to deeper due diligence.
6.3 Unresolved Attributes
In practice, the most interesting parts of the chart may be what is missing or what remains unresolved - qualities which are ‘othered’.
In this chart from a separate run looking at Caribou Biosciences (CRBU), Aquestive Therapeutics (AQST), Soligenix (SNGX) and Sarepta (SRPT), you can see there are a number of unresolved fields:
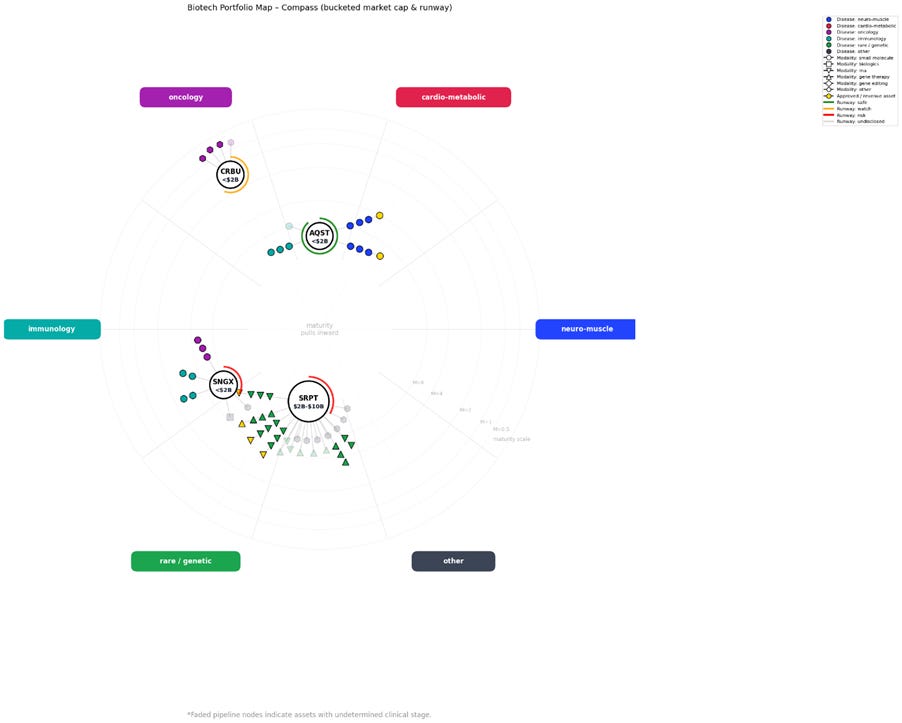
In this case, all four companies have one or more faded nodes, which appear when the data-collection pipeline (Strict Extraction and Gap Analysis) cannot identify reliable clinical phase information for a given asset.
I am always pleased to see these as they are a ‘proof’ that the prompt system is behaving. Blanks are left blank and not filled by hallucination or inference, giving me confidence in the rest of the data collected.
From this chart, several questions immediately stand out. For example,
which assets are responsible for the faded nodes, and why couldn’t they be clearly defined?
Sarepta has around 13 assets with undetermined clinical phase,
seven of which also fall into the “other” category for both drug modality and disease area
My strict search and gap analysis were not able to annotate these fields reliably
Caribou’s entire pipeline falls into the “other” category for drug modality (hexagon shape).
I now understand this is because the company focuses on CAR-T therapies, which do not fit neatly into my current modality buckets.
Again, this reinforces confidence in the system: rather than hallucinating a classification, the LLM flags these assets as ambiguous instead of covering up the uncertainty.
Soligenix also has an asset with no assigned phase and an “other” classification for both modality and disease area.
This immediately prompts further investigation. I want to understand what this drug is and why it couldn’t be bucketed. It may simply be a preclinical asset with limited public information, or it may reflect something particularly unusual or interesting about the company.
In a nutshell, the attributes which don’t fit neatly into the Biotech Compass both demonstrate how disciplined the pipeline is, and provide starting points for further investigation.
6.4 Troubleshooting Chart Issues
The main issue you may encounter with the chart is overlapping companies. While this can be informative as it highlights companies operating in similar niches, it can impact readability.
This is demonstrated below in a chart from a run I performed analysing uniQure (QURE), Regenxbio (RGNX), Greenwich LifeSciences (GLSI), and Immunitybio (IBRX):
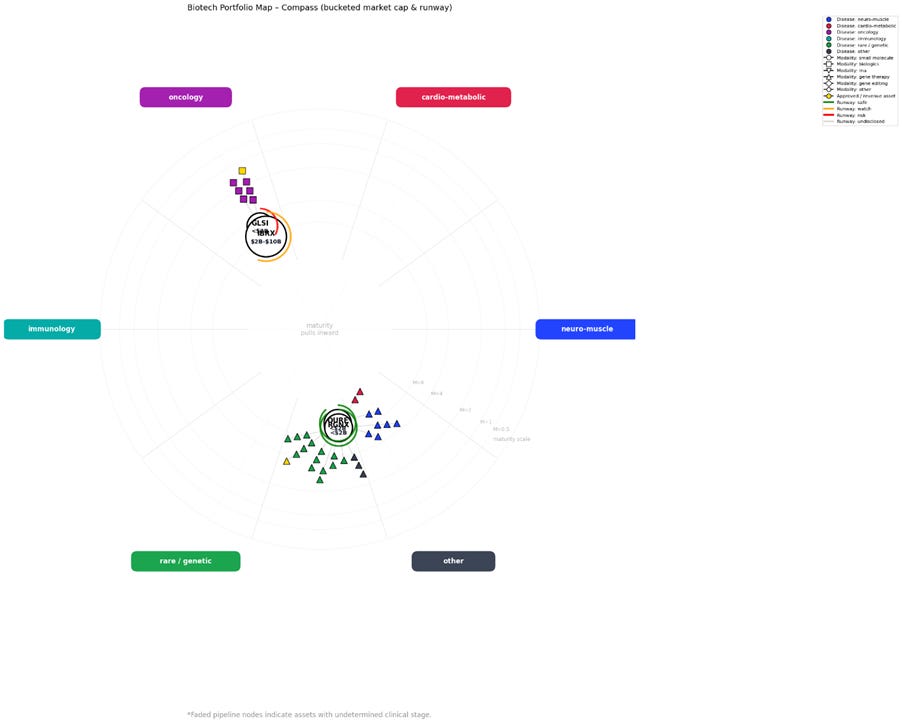
Both IBRX and GLSI overlapped, as did QURE and RGNX. The simplest solution in this case is to duplicate the CSV file and remove one of the overlapping companies from each copy. You can then re-run the code using these edited files to produce two complementary charts, as demonstrated below.

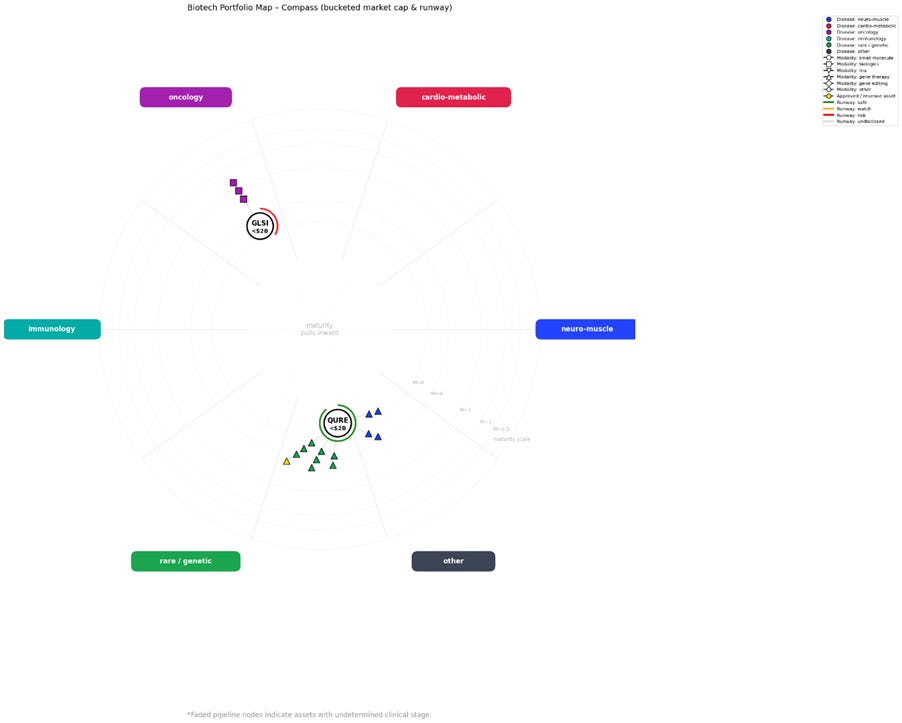
Be sure to rename the modified CSV files clearly and retain the original, unedited CSV for your records.
7. Generating Readable Briefings
So, you have your chart, an idea of what these companies look like, and a list of follow up questions you want to pursue.
Where do you start?
The great news is that you already have a clutch of documents with 90 % of the answers already in your working directory!
Strict Extraction (1)
Harmonised Summary (3)
Organised Data (4)
These raw text files are dense and not very readable (see the Raw Outputs here)
But - you can use them as inputs for separate ChatGPT prompts to produce readable articles limited only to the companies you are interested and with a full source list.
Sub-prompts for Readable Briefings
1. Strict Extraction: ‘Can you produce a magazine style article using only the information provided in this document? [your_run_id__strict_extraction.txt]
2. Harmonised Summary: ‘Can you produce a follow-up to the first article, highlighting new information that was previously missing, using only this document?’
[your_run_id__harmonised_summary.txt]3. Organised Data: Can you convert the information in this document into clear and readable tables? [your_run_id__organised_data.txt]
Combining this output with the chart into a single PDF produces a roughly 20-30 minute read that captures everything you need to know about the companies you are interested in.
I call this output ‘Readable Briefings’ and you can see an example of the sort of content you can automatically generate using this approach here
You can view together:
An easy to read magazine article
Clear Asset tables
The Biotech Compass Chart
Reading this over a coffee brings me up to speed on up to five diverse companies simultaneously and painlessly.
This is not supposed to be sufficient due diligence to begin investing in a company, but should provide a strong entry point to informed diligent research.
Used this way, the Biotech Compass can comfortably take you from uninformed to knowledgeable in under an hour. You gain a working understanding of a company’s niche, how it operates, its risk profile, and whether it’s the type of business worth deeper investigation. Crucially, you’re also in a position to follow, and meaningfully engage with, online discussion about these companies.
Readable briefings: An Example
For an example of this output, I have produced one of my ‘magazine-style’ LLM generated outputs for the companies we started with on this walkthrough: BEAM, KNSA, PTCT, VKTX, and GOSS. Remember, the input files to generate this output are fully sourced, and all sources are listed. You can see the raw output of all 5 steps of the Biotech Compass here for the companies we explored today.
The real value of this output is that you can use it however you like.
Do you have a better way to read the chart? As more people start to trial the Biotech Compass, I’d be really interested to hear how you interpret the chart and what it leads you to explore next.
If you’d like to explore further, here are the key companion articles:
If you’re new to the Biotech Compass:
→ The Biotech Compass Hub: All the Biotech Compass Resources in One Place
For a detailed overview of how the Compass works:
→ The Biotech Compass: A Practical Tool for Biotech Investors
If you want to run the tool yourself:
→ The Biotech Compass v1.0: Prompts and Code
If you want to see a full example of the readable output:
→ The Biotech Compass: Readable Briefings
If you want to explore the raw output files:
→ The Biotech Compass: Raw Output
The Biotech Compass has been a two-month project aimed at overhauling how we research and analyse biotech companies. If you’ve found this tool useful or it has helped your own research, consider becoming a paid subscriber to my Substack.
I work on this independently and in my own time, so financial support helps me continue writing articles and developing tools like this. While Biotech Compass v1.0 will remain freely available to all subscribers, paid subscribers will receive access to future patches and upgrades, as well as additional tools and deeper-dive analyses as the project evolves.
Please feel free to get in touch with any questions or suggestions.
Contact
I look forward to feed back on the Biotech Compass. If you wish to get in touch, you can contact me via:
Substack: thepharmafox.substack.com
Email: contact@thepharmafox.com
© 2026 The Pharma Fox. All rights reserved.
The codes and accompanying prompts associated with the Biotech Compass are provided for personal use by individual subscribers only. Redistribution, sharing, publication, or commercial use - in full or in part - is not permitted without prior permission. No reposting or mirroring of the prompts/code (including in other newsletters, GitHub repos, or prompt libraries).
All prompts, code, and figures remain the intellectual property of The Pharma Fox.
For educational purposes only. Not investment advice. You are responsible for verifying outputs against primary sources.
This is super neat. I love the work you've put into this. Hope to try it out when I get the chance!
Very high technical content but I like the style. Will deep dive into each articles and feedback. Thanks for the sharing.